.jpg)

_06_19_2026_10_41_46_758506.jpg)


Summary
- UK shares slipped in red with FTSE 100 eroding all the morning gains
- GBP to USD surged over 1 per cent, largely due to greenback’s weakness
- BoE had fixed a reference exchange rate of 1.3979 USD on 7 May
UK shares fell into the negative region with the benchmark FTSE 100 eroding all the gains in the late afternoon deals on Monday, 10 May, after the Great Britain pound (GBP) staged a sharp comeback against the United States dollar (USD). As per the latest foreign exchange data available, the GBP to USD pair surged more than 1 per cent, largely due to the greenback’s weakness against a bunch of currencies.
Pound’s strength wobbles equity
The currency pair was trading at 1.4133, up 1.15 per cent from the last close of 1.3972 on the interbank foreign exchange market. In the intraday day trades, GBP to USD shuttled between a range of 1.3997 and 1.4158. The weakness of the US dollar index also contributed to the upsurge in the GBP.
Pound sterling has managed to surpass a level of 1.41 after a period of nearly two-and-a-half months. The Bank of England had fixed a reference exchange rate of 1.3979 USD and 1.1513 EUR against a unit of sterling on 7 May 2021.
Negative start to week
The improved economic outlook for the United Kingdom and the deceased expectations of Scottish independence also supported the pound sterling during the day. The market participants are now looking forward to the macroeconomic releases in the week ahead with the Office for National Statistics (ONS) slated to release the preliminary GDP growth rate for the first quarter of 2021.
According to the London Stock Exchange, FTSE 100 went sharply into red even after the house price index released by Halifax reported a 8.2 per cent growth in the house prices on a year-on-year basis, while the average house prices in the UK jumped 1.4 per cent sequentially. The index was trading at 7,110.16, down 0.27 per cent from the previous close of 7,129.71.
FTSE 100 chart (10 May)
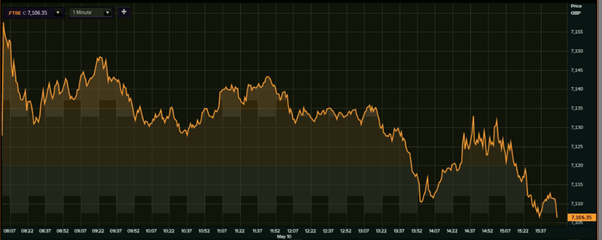
(Source: EODHD/Others, Thomson Reuters)
During the session today, the headline index hovered between a high and low of 7,164.18 and 7,105.12, respectively. The losses of mid-cap barometer FTSE 250 were even larger following the partial jittery due to the ongoing corporate earnings season. The index fell as much as 0.49 per cent to 22,663.41, from the previous close of 22,775.28.
Other market capitalisation-based indices observed a largely similar fall as compared to the FTSE 100, but the losses were on a higher side. Both FTSE 350 and FTSE All-Share shed nearly 0.35 per cent each.
