


Associated British Foods Plc
The UK based Associated British Foods plc (ABF) is one of the leading diversified food, ingredients and retail groups. The groupâs major businesses include Sugar, Ingredients, Grocery, Agriculture and Retail. ABF caters its products primarily to industries including Agriculture, Pharmaceutical, Retail and Food. Capital Research Global Investors, Norges Bank Investment Management (NBIM), and The Vanguard Group, Inc. are the top institutional shareholders in the company.
Trading update released on July 4th, 2019
On constant currency basis, the companyâs revenue from continuing businesses for the 40 weeks ended June 22, 2019, was up by 3 per cent as compared with the corresponding period of the last year, while on actual exchange rates (AER), increased by 2 per cent. On a constant currency and AER basis, the sales from continuing business (excluding sugar division) surged by 4 per cent as compared to the same period previous year data. The company expects Primark to do well going forward.
Recent Developments
Sales at Primark (the companyâs clothing segment) in the year-to-date improved by 4 per cent from the previous year at constant currency and AER. This can be attributed to increased selling space. In the United Kingdom, Primark recorded a significant surge in market share. The trading was strong at new stores and there is plenty of encouragement through the customerâs reaction regarding the full product range along with the new Food & Beverage, wellness services offered at Birmingham High Street. Due to unfavourable weather this May, sales were affected but it picked up in June. In the US market, the company did well and achieved strong total sales growth.
Financial Highlights (H1 FY2019, £ million)
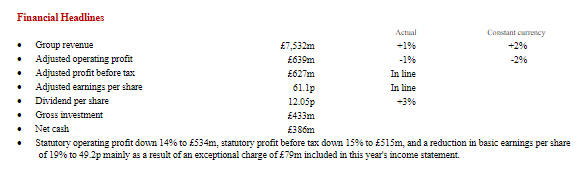
(Source: Companyâs filings, LSE)
 On a constant currency basis, the group revenue surged by 2 per cent to £7,532 million as against H1 FY18 data. There was decline of 2 per cent on the adjusted operating profit to £639 million in H1 FY19 as against the previous year.
On AER basis, the companyâs reported revenue surged by 1 per cent as compared to £7,422 million in H1 FY18. Adjusted operating profit decreased by 1 per cent against the corresponding period of the last year, due to the changes in the sterling exchange rate. Adjusted Profit before tax stood at £627 million and in line against the previous year same period data. Adjusted earnings per share (EPS) were in line with the previous year at 61.1 pence. The board declared an interim dividend per share of 12.05 pence, an increase of 3 per cent as compared to 11.70 pence in H1 FY18. Gross investment and net cash stood at £433 million and £386 million respectively.
Associated British Foods plc (ABF) Share Price Performance
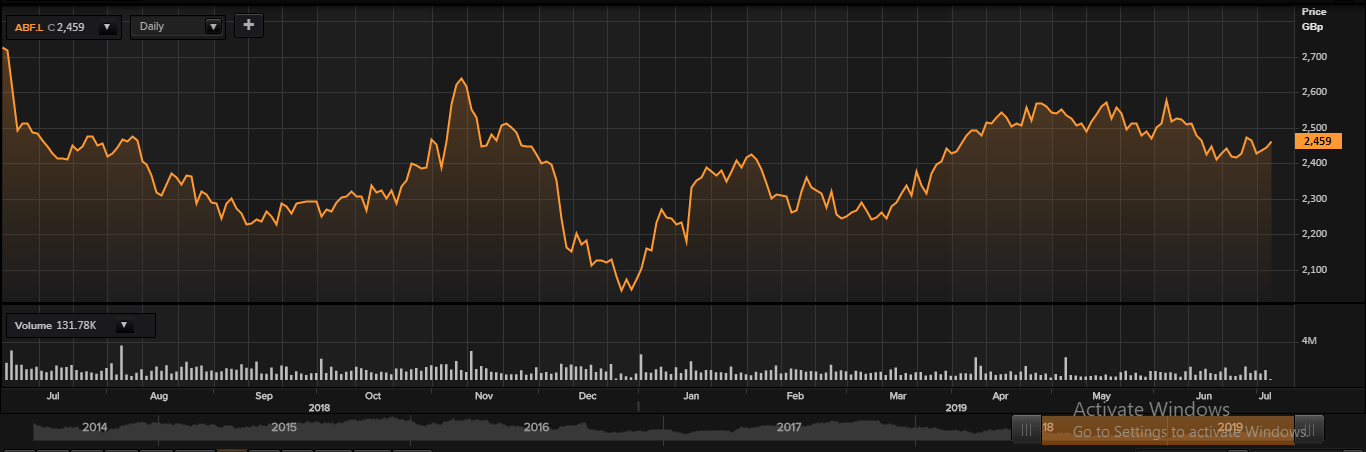
Daily Chart as at July-04-19, before the market closed (Source: Thomson Reuters)
On 4th July 2019, at the time of writing (before the market close, GMT 11:10 AM), ABF shares were trading at GBX 2,459 and increased by 0.614 per cent against the previous day closing price. Stock's 52 weeks High and Low is GBX 2,659/GBX 2,011. The companyâs stock beta stood at 1.03, tracing the path of the benchmark index.
Stock's average traded volume for 5 days was 974,086.40; 30 days â 800,856.87and 90 days â 777,416.87. The average traded volume for 5 days was up by 21.63 per cent as compared to the 30 days average traded volume. The companyâs outstanding market capitalisation stood at £19.38 billion.
Diageo PLC
Diageo Plc (DGE.L) is a global manufacturer and distributor of premium spirits, beer, and wine products. The companyâs operations include producing, distilling, brewing, bottling, packaging, distributing, developing and marketing branded alcoholic beverages. It markets and sells these products through 200 well-known brands, which are sold in approximately 180 countries. It also produces ready to drink products in the UK, Italy, Africa, Australia, the US, and Canada.
The company classifies its business operations into the following reportable segments: North America, Europe, Russia, and Turkey; Asia Pacific, Africa, Latin America, and the Caribbean. These segments offer products under five categories: Spirits, Beer, Ready to Drink, Other and Wine. These comprise of scotch, vodka, North American whiskey, Indian made foreign liquor (IMFL) whiskey, rum, gin, beer, ready-to-drink products, other alcoholic beverages, and tequila.
Recent News
As per the data provided by the market experts, Diageo Plc (DGE.L) is expected to generate an earnings growth of around 9 per cent. The recent trade activities had a negligible effect on the stock exchange (London Stock Exchange) but Diageo Plc which is one of the heavyweights of the stock market made a new high in the morning session on 3rd July 2019, Wednesday.
Financial Highlights for H1 FY19 (£, million)
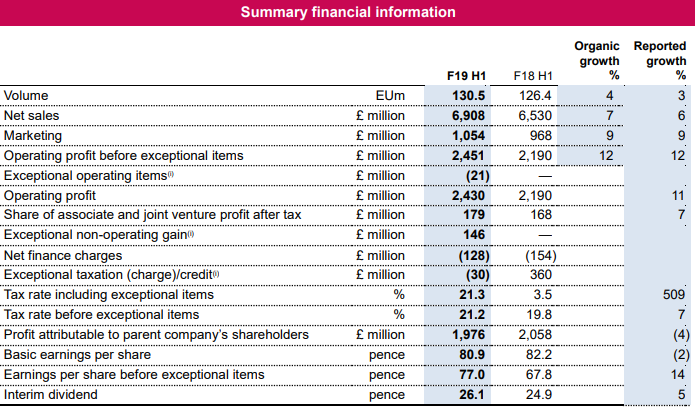
(Source: Half Yearly report, Companyâs website)
Â
Reported net sales was reported at £6.9 billion for H1 FY19 as against £6.5 billion in H1 FY18. The operating profit of the company was up by 11 per cent and stood at £2.4 billion for the period as against £2.1 billion in H1FY18 largely due to organic growth.
The organic operating profit rose 12.3 per cent which was way more than the revenue growth. This can be attributed to improved pricing and production efficiency which offset the higher marketing costs and inflation.
Apparently, the company looks financially strong with net cash from operations at £1.6 billion, which was up by £356 million from the comparable period the previous year. Similarly, the free cash flow was up by £317 million from the comparable period of the previous year and stood at £1.3 billion in H1 FY19.
The basic EPS of the company stood at 80.9 pence in H1 FY19, which was down by 1.6 per cent from 82.2 pence in H1 FY18.
The EPS (before exceptional items) of the company stood at 77 pence for the period, which was up by 13.6 per cent from 67.8 pence in H1 FY18. This can be attributed to the rise in operating profit margins and lower finance costs, which helped in offsetting an increased tax charge. The interim dividend declared by the company stood at 26.1 pence for the period which was 5 per cent more than the (24.9 pence) dividend for the comparable period in the previous year.
Diageo Plc Share Price Performance
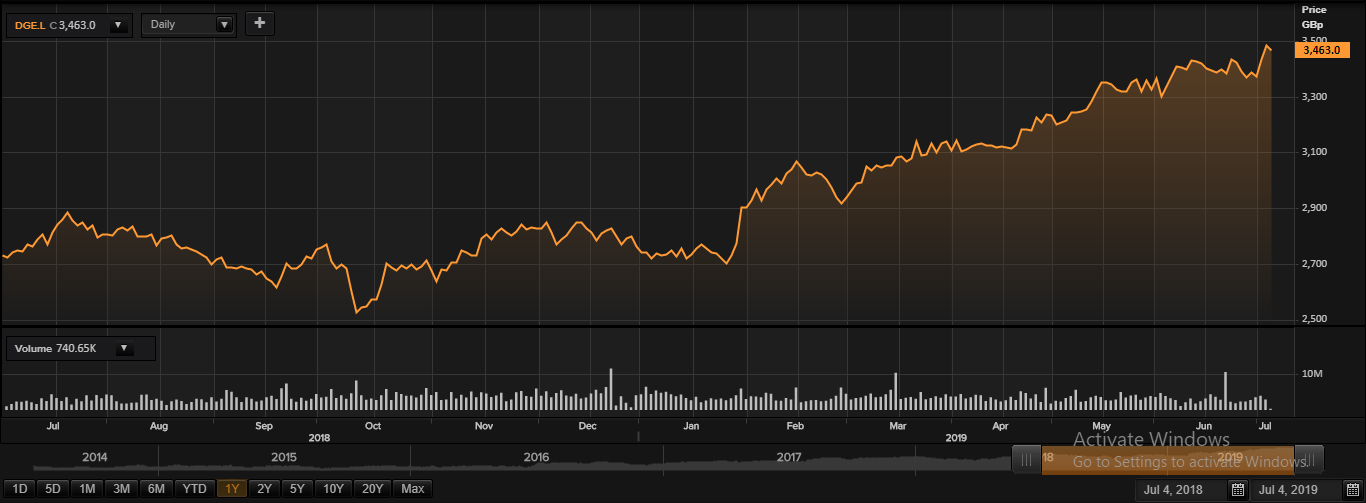
Daily Chart as at July-04-19, before the market closed (Source: Thomson Reuters)
On 4th July 2019, at the time of writing (before the market close, GMT 02:47 PM), Diageo Plc shares were trading at GBX 3,463 and declined by 0.55 per cent against the previous day closing price. Stock's 52 weeks High and Low is GBX 3,500.50 /GBX 2,513.00. The companyâs stock beta stood at 0.77, which makes it less volatile in comparison to the benchmark index.
Stock's average traded volume for 5 days was 3,340,416.00; 30 days â 3,645,796.87and 90 days â 3,817,862.52. The average traded volume for 5 days was down by 8.38 per cent as compared to the 30 days average traded volume. The companyâs outstanding market capitalisation stood at £82.75 billion.
Petrofac Ltd
Petrofac Limited (PFC) is an international company into oilfield services, providing integrated services to the manufacture and processing companies. The group builds and designs oil and gas facilities; manages, maintains and operates facilities on behalf of its consumer and trains personnel. The company also co-invests and develops in infrastructure and upstream projects.
Financial Highlights â FY2018 (US$, million)
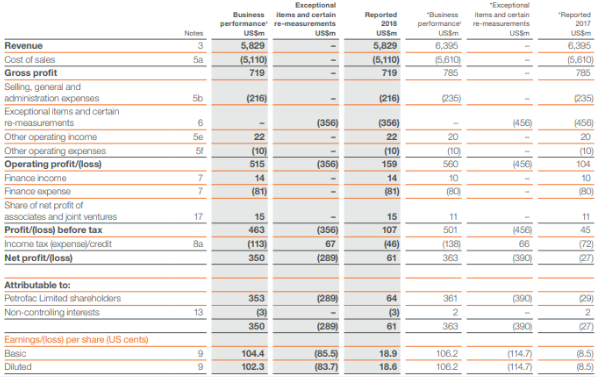
(Source: Annual report, Companyâs website)
For the FY ending 31st December 2018, the company reported revenue of $5,829 million, a decrease of 8.85 per cent over FY2017 of $6,395 million. EBITDA dipped by 10 per cent to $671 million as compared with the financial year 2017 data of $748 million. Operating profit of the company stood at $159 million in FY2018 against $104 million in FY2017.
The reported profit before tax for FY2018 increased by $62 million to $107 million from $45 million in FY2017. The net profit of the company was $61 million in FY2018 as compared to a net loss of $27 million in FY2017.
The groupâs reported basic earnings per share was 18.9 cents in FY2018, as compared to a loss per share of 8.5 cents in FY2017. The dividend per share was 38.0 cents which remained flat for FY2018 as compared to the last year.
Petrofac Limited (PFC) Share Price Performance
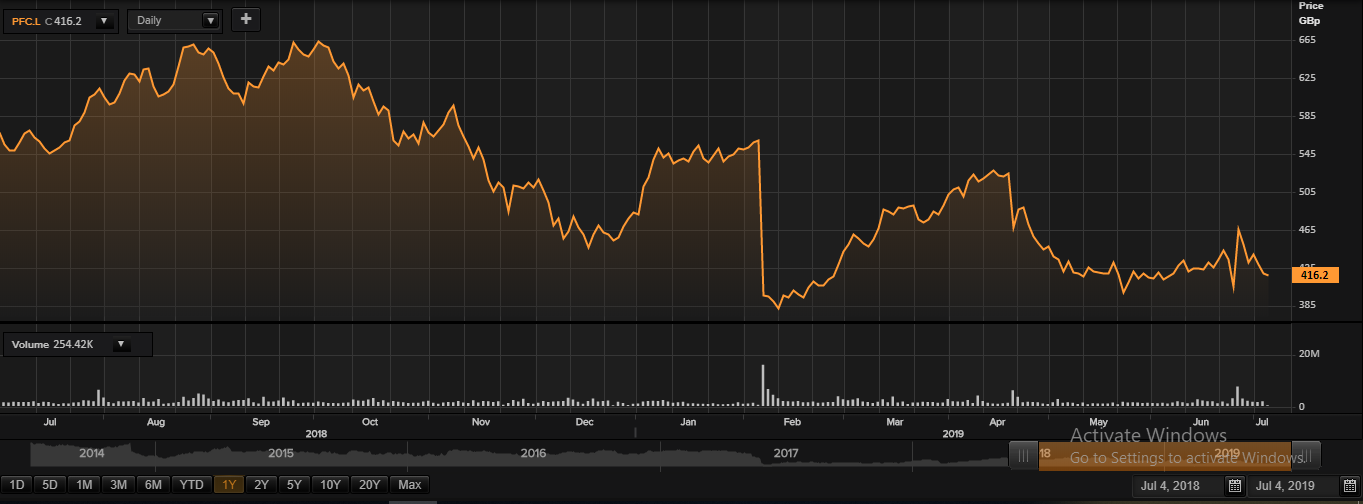
Daily Chart as at July-04-19, before the market closed (Source: Thomson Reuters)
On 4th July 2019, at the time of writing (before the market close, GMT 03:02 PM), Petrofac Limited shares were trading at GBX 416.2 and dipped by 0.50 per cent against the previous day closing price. Stock's 52 weeks High and Low is GBX 679.00 /GBX 376.40. The companyâs stock beta stood at 0.60, which makes it less volatile in comparison to the benchmark index.
Stock's average traded volume for 5 days was 1,950,356.00; 30 days â 1,751,378.97and 90 days â 1,727,793.70. The average traded volume for 5 days was up by 11.36 per cent as compared to the 30 days average traded volume. The companyâs
