


_06_19_2026_12_34_15_139937.jpg)

The technology sector works in a competitive and fast-paced environment, where the prevalent technology can change very frequently, or disruptive product can take the market by storm. Hence the technology companies are willing to reinvest part of their earnings or they consider investing in the R&D rather than paying dividends to the shareholders. Letâs deal with some of the tech companies who have been reluctant in paying a dividend to the shareholders.
Seeing Machines Ltd
Seeing Machines Ltd (SEE) is a technology hardware & equipment company enabling the machines to see, understand and assist people using Artificial Intelligence (AI). The companyâs DMS (driver monitoring systems) are used in fleet trucks and cars, and ADAS (advanced driver assistance systems) are used in tram, railways and aviation. The company has a presence in Australia, Asia Pacific, the Middle East, Latin America, Europe and North America. The companyâs major clients include Transport for London, Coach USA, Progress Rail, Bosch, General Motors, Emirates and Caterpillar.
SEE-Financial Highlights for FY19
For the financial year ending 30th June 2019, driven by the higher rendering of services for the period, the companyâs revenue increased slightly to AUD 31,888,346 as against AUD 30,716,369 in the financial year 2018. Due to the lower cost of sales in FY2019, the gross profit surged from AUD 7,627,165 in FY2018 to AUD 18,733,045 in FY2019. Driven by an increase in the operating and non-operating expenses for the period, the company reported an LBT (loss before tax) of AUD 41,748,980 in FY2019 versus an LBT (loss before tax) of AUD 35,985,457 in FY2018. Driven by an increase in the tax expenses for the period, the company reported a LAT (loss after-tax) of AUD 41,794,940 in FY2019 versus a LAT (loss after-tax) of AUD 36,013,861 in FY2018. The companyâs basic and diluted loss per share stood at AUD 0.0169 in FY2019 versus a basic and diluted loss per share of AUD 0.0221 in the financial year 2018. The company has not announced any dividend for the year.
The company had shown a decline in the financial performance for the first half of the financial year 2019. Although the companyâs revenue had increased, the bottom-line performance had declined for the period. The company had not been able to control its operating and non-operating expenses effectively, which had resulted in a decline in the profitability for the period.
The company operates in a challenging environment which requires continuous investment, sometimes at the cost of profitability, to stay ahead of competitors. As the company operates in multiple geographies, its profits can be impacted negatively due to the foreign exchange rate fluctuations.
SEE-Share price performance
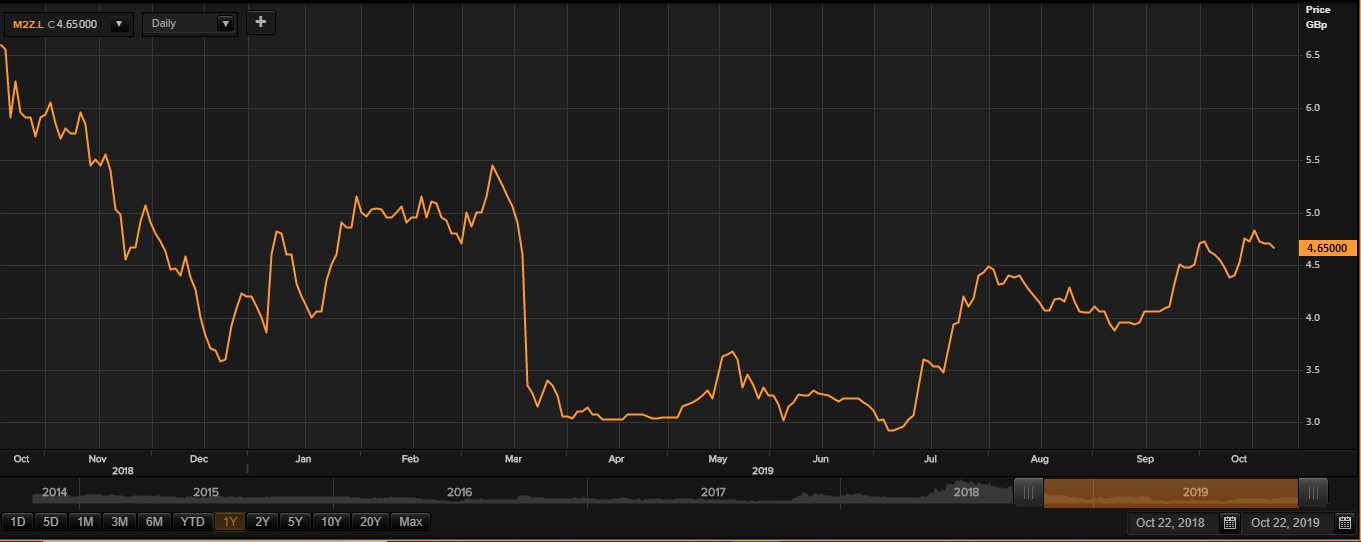
(Source: TR)Â Â Â Â Â Â Â Â Â Â Â
At the time of writing (22/10/19 before the market close, at 10:21 AM GMT), shares of the SEE were trading at GBX 4.65 and plunged by 1.06 per cent against the previous day closing price.
Volume Summary
The 5-day average daily shares that exchanged hands stood at 5,780,846.80, which was around 18.39 per cent below the 30-day average daily volume (7,083,577.13) that exchanged hands at the London Stock Exchange. Todayâs volume in the stock stood at 442,521 with 8 trades taking place at the London Stock Exchange (before the market close).
52wk H/L range
In the past 52-wks, shares of the SEE have registered a high price of GBX 6.65 and a low price of GBX 2.85, and at the current trading level, as quoted in the price chart, shares were quoting around 63.15 per cent above the 52w low price level.
Price Performance (%)
On a YoY basis, shares of SEE have delivered a negative price return of 28.79 per cent and the benchmark index by approximately 29.92 per cent down over the same period. However, on a year-to-date basis, the stock has recorded a positive price return of approximately 11.90 per cent and was up by around 5.10 per cent in the past one month.
Simple Moving Average (SMA)
From the Simple Moving Average standpoint, shares were quoting above the 200-day simple moving average price and were quoting above its 60-day and 30-day SMA prices as well.
Relative Strength Index (RSI)
The 30-day and 14-day relative strength index were strengthening at 62.00 and 62.12, respectively.
Blue Prism Group PLC
AIM-listed Blue Prism Group PLC (PRSM) is a Robotic Process Automation (RPA) provider, which enables a wide range of customers around the globe to intelligently automate their business processes, in order to cut costs by automating repetitive tasks and freeing up hours of work. The companyâs operations are differentiated in three geographical segments: EMEA Operations, the Americas Operations and APAC Operations.
PRSM-Recent announcements
On 23rd January 2020, the company will announce the 2019 full-year results. Dr Jason Kingdon will shoulder the responsibilities of an Executive Chairman (full-time) for Blue Prism Group PLC.
PRSM-Financial highlights for H1 FY19
Recognised revenue for the period expanded by 76 per cent to GBP 40.4 million (IFRS 15) while group revenue, under the IAS 18 standard, grew by 82 per cent to GBP 41.6 million. Driven by new sales and upsells with 911 deals in the period, the monthly exit recurring revenue stood at GBP 7.6 million. Adjusted EBITDA losses increased to GBP 34.0 million from a loss of GBP 4.2 million, while loss from operations (including share-based payments) for the period was GBP 35.0 million, versus a loss of GBP 5.5 million in 1H18 and operating loss before share-based payments was £34.3 million (1H18: a loss of £4.3 million). On 30th April 2019, the cash and cash equivalents were GBP 129.4 million. The company once again had not announced any dividend.
The company on 16th July 2019 announced that all conditions related to the completion of the acquisition of Thoughtonomy were satisfied and 1,074,711 new ordinary shares were added to the share capital of the group. This acquisition would open the mid-tier of the market for the group as it will provide the company with a productive solution which is expected to simplify and broaden access to its connected-RPA platform.
As the company faces strong competition in a rapidly evolving market, the financial viability of the group can be impacted due to the dynamic nature of the industry which is characterised by the development of new artificial intelligence technology.
For the full-year 2019, revenues will increase by £0.5 million; the EBITDA loss will decrease by £11.2 million. The company is well-positioned to capitalise on the new growth opportunities, and the Robotic Process Automation continues to develop into a significant software category.
However, there are some potential risks involved. The companyâs business model might not get appreciated by the market, and there are reliability issues with the software. The software industry already has a fast-paced environment and change in technology can be demotivating for the company.
PRSM-Share price performance
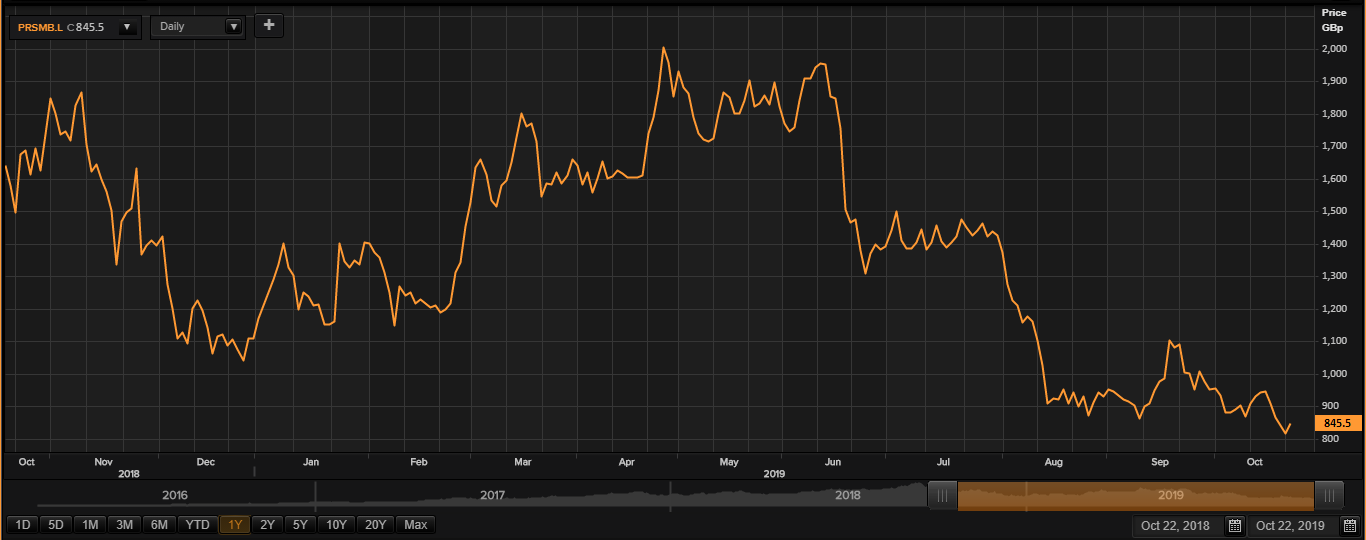
(Source: TR)
At the time of writing (22/10/19 before the market close, at 10:28 AM GMT), shares of the PRSM were trading at GBX 845.5 and surged by 3.86 per cent against the previous day closing price.
Volume Summary
The 5-day average daily shares that exchanged hands stood at 307,890.60, which was around 29.59 per cent below the 30-day average daily volume (437,294.30) that exchanged hands at the London Stock Exchange. Todayâs volume in the stock stood at 37,621 with 128 trades taking place at the London Stock Exchange (before the market close).
52wk H/L range
In the past 52-wks, shares of the PRSM have registered a high price of GBX 2,030.00 and a low price of GBX 800.67, and at the current trading level, as quoted in the price chart, shares were quoting around 5.59 per cent above the 52w low price level.
Price Performance (%)
On a YoY basis, shares of the PRSM have delivered a negative price return of 50.31 per cent and the benchmark index by approximately 51.09 per cent down over the same period. However, on a year-to-date basis, the stock has recorded a negative price return of approximately 26.40 per cent and was down by around 25.32 per cent in the past one month.
Simple Moving Average (SMA)
From the Simple Moving Average standpoint, shares were quoting below the 200-day simple moving average price and quoting below its 60-day and 30-day SMA prices as well.
Relative Strength Index (RSI)
The 30-day and 14-day relative strength index were strengthening at 38.27 and 34.33, respectively.
