


.jpg)

Polarean Imaging PLC (POLX) issued an update on Phase III Clinical Trials
Polarean Imaging Plc (founded in 2011) is a medical imaging technology company which strives to research, develop and commercialize hyperpolarization systems for biomedical imaging research. The company manufactures high-performance MRI radiofrequency (RF) coils for imaging Xenon gas in the MRI system. Polarean Imagingâs products find application in the study, diagnosis and monitoring of various diseases, including chronic obstructive pulmonary disease (COPD), cystic fibrosis, asthma, stent placement, and radiotherapy.
Recent News
The Clinical Trials resulted in significant progress (at the University of Virginia and Duke University). The company uses Magnetic Resource Imaging (hyperpolarised 129-Xenon gas) for the diagnosis of pulmonary ventilation to test the drug-device combination to prove non- inferiority.
Enrolment for the Clinical Trials has now passed 85.4 per cent of the lung transplant pathway and 62.5 per cent of lung resection pathway.
 To improve the enrolment ratio for the lung resection pathway, the Company will now add a third trial site at the UC (University of Cincinnati), which is one of the Company's critical clinical collaborators. The directors remained content and hopeful that the Company is doing well on timelines regarding the submission of a New Drug Application to the FDA (Food and Drug Administration); and will continue to do so. If this gets approved by the FDA, then the commercial launch is expected in H2 FY2020.
Financial Highlights (H1 Financial Year 2018, US$)
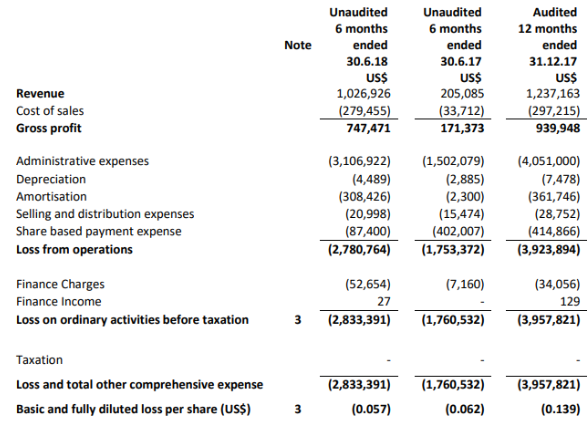
(Source: Interim Report, Company Website)Â
The companyâs revenue rose from $0.20 million in H1 FY17 to $1.03 million in H1 FY18. Gross profit in H1 FY18 stood at $0.75 million, while gross operating margin remained at well over 50 per cent. With a sizeable surge in the administrative expenses, overall loss before tax increased to £3.1 million from £1.4 million in the same comparable period of the last year. Basic and fully diluted loss per share was $0.057 as compared with the last year same period data. At Jun 30, 2018, the net cash stood at $1.22 million.
The company will initiate the clinical trials of the installed base of systems over additional sales of research units to academic institutions in FY2018. The pulmonary disease in the United States has affected around $150 billion and is growing at a faster pace and will approximately impact 40 million Americans.
The company believes that there is untapped potential for non-invasive, cost-effective, and quantitative image-based diagnosis technology, considering the constraints of existing methodology. The company also believes in this drug-device combination (using 129Xe), which offers the ideal remedy for taking diagnosis a level up in the realm of pulmonary disease. The group is confident that this will be borne out during the Phase III trials. Also, the company has developed dense working relationships with MRI systems manufacturers and exclusive relationships with worldwide industrial gas suppliers.
Polarean Imaging Plc Share Price Performance
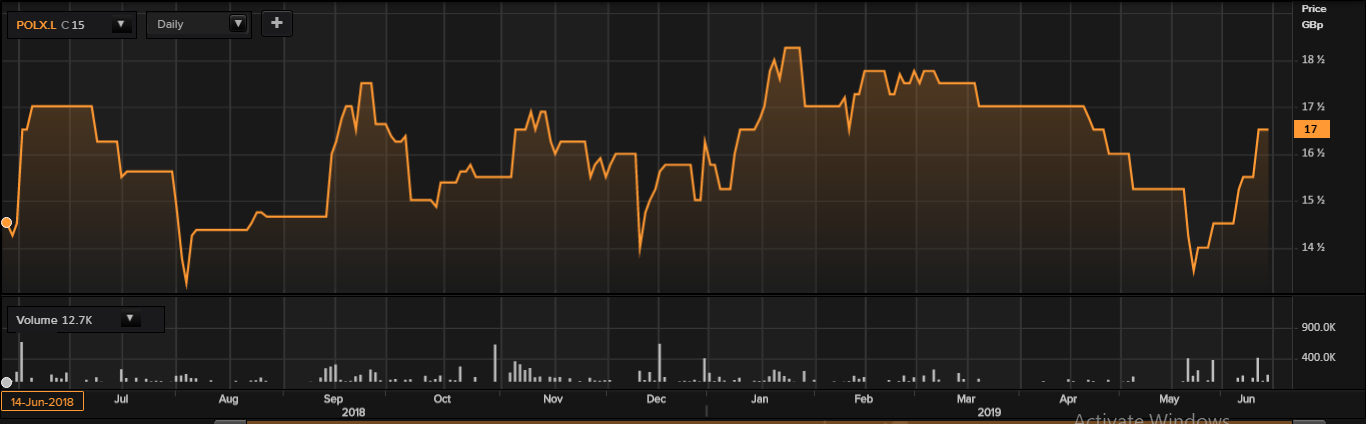
Daily Chart as at June-14-19, after the market closed (Source: Thomson Reuters)
On June 14, 2019, shares of Polarean Imaging Plc closed at GBX 17 per share and remained flat against the previous day closing price level. The outstanding market capitalisation of the company stood at around £17.36 million.  In the last 52-wks, shares of Polarean Imaging Plc have registered a high of GBX 19.19 (as on Jan 23, 2019) and a low of GBX 13.50 (as on May 23, 2019). At the current trading level, as quoted in the price chart, its shares were trading 11.41 per cent below the 52wk high price level and 25.93 per cent above the 52wk low price level.
Today's volume in the stock stood at 115,700. Stock's average traded volume for 5 days was 137,069.60; 30 days â 77,489.00 and 90 days 82,929.11. The average traded volume for 5 days was up by 76.89 per cent as compared to the 30 days average traded volume.
From the SMA standpoint, shares of the Polarean Imaging Plc were quoting above its 30-days, 60-days and 200-days SMA prices, which is a bullish technical indicator and indicates that the stock could rise further from the current trading levels.
In the past 1 year, shares of Polarean Imaging Plc have delivered a positive price return of 13.33 per cent. In addition, on a year-to-date basis, the stock was up by approximately 9.68 per cent and declined by 5.56 per cent in the past three months.
Share's RSI for the 30-days, 14-days and 9-days stood at 58.42, 73.39 and 83.87 respectively. However, the 3-days RSI of the stock stood at 99.61.
Consort Medical PLC (CSRT) recently announced Full year results FY 2019
Consort Medical Plc is a leading CDMO (Contract Development & Manufacturing Organisation) which has a presence globally and operates in the Health Care Equipment & Services sector. They offer a single source for drug and device development, formulation, manufacturing and relevant technology to their clients, from two integrated operating divisions namely Bespak (devices) and Aesica (drugs). Bespak has a manufacturing capacity of more than 500 million devices per year in regulated markets along with the expertise of consistently delivering Six Sigma quality or equivalent for high volume medical components and devices.
Financial Highlights for Financial Year 2019 (£, million)

(Source: Annual Report, Companyâs website)
A sound financial performance overall, with underlying Profit before Tax remained same as the previous year at £38.2 million despite the impact of the previous delay in the approval of Mylan's Wixela programme which was offset by favourable foreign exchange movements and lower pension charges. Bespak is leading across the sector in EBIT margin which stood at 20.3 per cent after investing in Research & Development on new opportunities, however revenues this year have gone down as compared to the previous year.
For Aesica, the EBIT margin was consistent, despite lower revenues. Net debt stood at £97.4 million which was expected this year as against £95.5 million in FY 2018, and the balance sheet remains solid with net debt to EBITDA at 1.8 times. The company recommended a final dividend of 13.8 pence. The total dividend would amount to 21.4 pence (FY2018: 21.0p).
Consort Medical Plc Share Price Performance
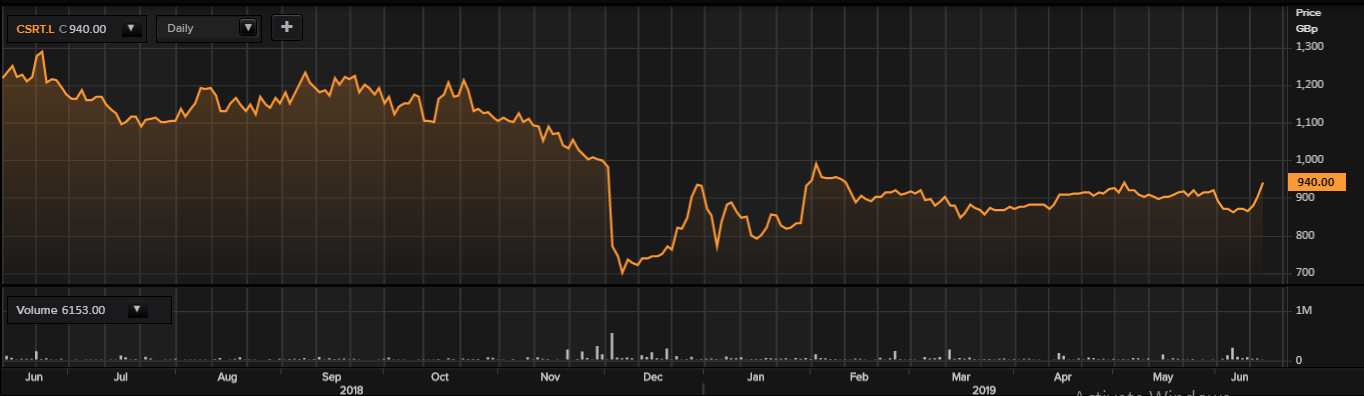
Daily Chart as at June-14-19, after the market closed (Source: Thomson Reuters)
On June-14-19, shares of Consort Medical Plc closed at GBX 940 per share and added 4.44 per cent against the yesterday's closing price level. The outstanding market capitalisation of the company stood at around £467.05 million with a dividend yield of 2.28 per cent.
In the last 52-wks, shares of Consort Medical Plc have registered a high of GBX 1,294 (as on Jun 22, 2018) and a low of GBX 700 (as on Dec 06, 2018). At the current trading level, as quoted in the price chart, its shares were trading 27.36 per cent below the 52wk high price level and 34.29 per cent above the 52wk low price level.
Today's volume in the stock stood at 6,153. Stock's average traded volume for 5 days was 22,137.60; 30 days â 26,084.27 and 90 days â 23,709.26. The average traded volume for 5 days was down by 15.13 per cent as compared to the 30 days average traded volume. The companyâs stock beta was 0.58, reflecting lower volatility as compared to the benchmark index.
