


Cineworld Group Plc
Cineworld Group Plc (CINE) is a Brentford, the United Kingdom based media and entertainment company that operates as a Theatre cinema group across the world. The company majorly operates through five of its brands - Regal, which has around 7269 screens across 555 locations, Cineworld, which has 1038 screens across 100 sites, Cinema City, Cinema City, Yes Planet and Picture house.
CINE Latest News
On 15th November 2019, the company made a press release to announce that Helen Weir was appointed as a member of the Audit Committee and the Remuneration Committee, and Rick Senat stepped down as a member of the Audit Committee.
CINE Stock Price Performance
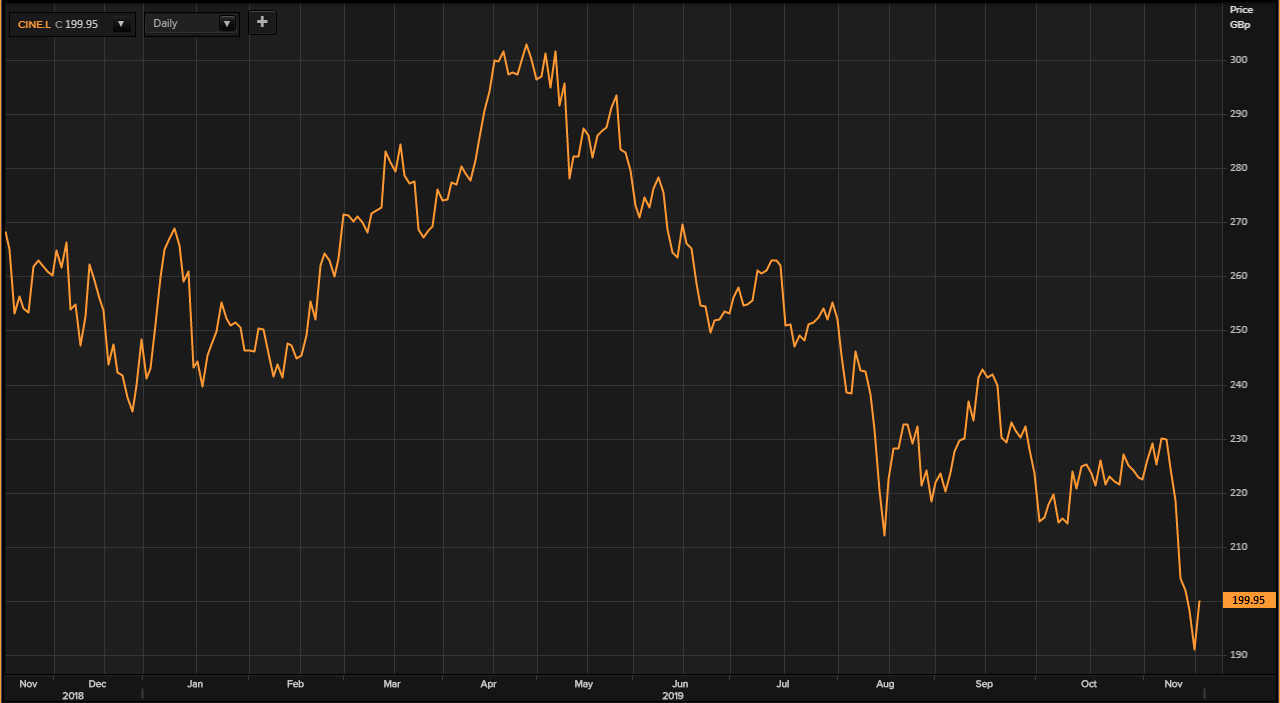
Daily Chart as at 19-November-19, before the market close (Source: Thomson Reuters)
On 19th November 2019, at 08:15 A.M GMT, While writing, Cineworld Group Plcâs stock price has been reported to be trading at GBX 199.95, an increase of 4.69 per cent or GBX 8.95 per stock as compared to the previous dayâs closing price, which was reported to be at GBX 191.00. By the time of writing, the Cineworld Group Plc stock was reported to have been trading 4.85 per cent above the 52-week low stock price, which was at GBX 190.70 per stock, that the companyâs stocks reached on November 18, 2019. This was also 34.22 per cent below the 52-week high price at GBX 303.99 per stock, which the companyâs stock achieved on May 08, 2019. Cineworld Group Plcâs reported market capitalisation (M-Cap) stands at a value of GBP 2.620 billion.
The average volume of trading per day for the companyâs stocks, for the last one year on the London Stock Exchange market, was of 5.67 million stocks. The stock has reportedly displayed a negative change of 28.79 per cent in value in the last one year, from the price of GBX 280.80 per stock. There also has been a negative movement in the last six months in the value of Cineworld Group Plcâs stock of around 33.08 per cent from the stock price of GBX 298.8 per stock. Cineworld Group Plcâs stock has also reportedly lost 9.65 per cent in value in the last one month from the price of GBX 221.30 per stock.
The beta of the Cineworld Group Plcâs stock was reported to be at 0.75. Through this, it can be inferred that the companyâs stock price movement is less volatile in its trend, as compared to the benchmark market indexâs movement.
Crest Nicholson Holdings Plc
Crest Nicholson Holdings Plc (CRST) is the UK domiciled residential development organisation with a major presence in Coastal and Southern parts of England. The organisation has a varied home portfolio developed for first time home purchasers that also includes huge family-size homes.
CRST Latest News
On 12th November 2019, the company announced that after a long tenure of service, Chris Tinker, Chairman of Major Projects and Strategic Partnerships, and recently appointed as Interim Chief Executive Officer, would be stepping down from his position from the Board on 31st December 2019.
CRST Stock Price Performance
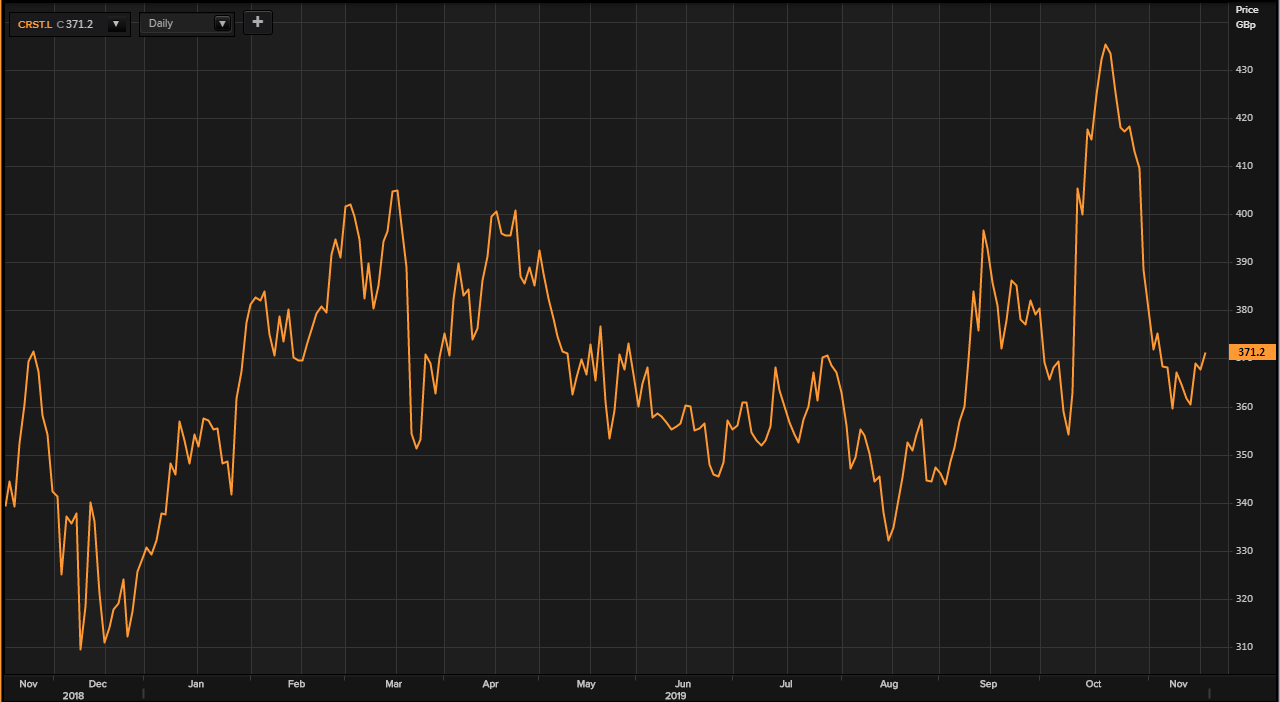
Daily Chart as at 19-November-19, before the market close (Source: Thomson Reuters)
On 19th November 2019, at 08:22 A.M GMT, While writing, Crest Nicholson Holdings Plc âs stock price has been reported to be trading at GBX 371.2, an increase of 0.98 per cent or GBX 3.60 per stock as compared to the previous dayâs closing price, which was reported to be at GBX 367.60 per stock. By the time of writing, the Crest Nicholson Holdings Plc stock was reported to have been trading 21.63 per cent above the 52-week low stock price, which was at GBX 305.20 per stock, that the companyâs stocks reached on December 18, 2018. This was also 15.10 per cent below the 52-week high price at GBX 437.20 per stock, which the companyâs stock achieved on October 22, 2019. Crest Nicholson Holdings Plcâs reported market capitalisation (M-Cap) stands at a value of GBP 944.44 million.
The average volume of trading per day for the companyâs stocks, for the last one year on the London Stock Exchange market, was 725,530 stocks. The stock has reportedly displayed a positive change of 7.84 per cent in value in the last one year, from the price of GBX 344.20 per stock. There also has been a positive movement in the last six months in the value of Crest Nicholson Holdings Plcâs stock of around 1.59 per cent from the stock price of GBX 365.40 per stock. Crest Nicholson Holdings Plcâs stock has also reportedly lost 14.07 per cent in value in the last one month from the price of GBX 432.00 per stock.
The beta of the Crest Nicholson Holdings Plcâs stock was reported to be at 0.63. Through this, it can be inferred that the companyâs stock price movement is less volatile in its trend, as compared to the benchmark market indexâs movement.
Future Plc
Future Plc (FUTR), the UK based media and publication organisation, which distributes fifty magazines in subjects like photography, computer games, music, films, innovation, home improvement and information. The organisation possesses 132 brands and additionally gives solutions in Advertising arrangements, event management, e-commerce, digital licensing and audience insights.
FUTR Financial Performance
On 15th November 2019, the company released its results for the financial year ended on 30th September 2019. The company reported that there was an 11 per cent organic revenue growth and around 32 per cent Media organic revenue growth. The company also reported that there was Adjusted operating profit of £52.2 million and an adjusted diluted EPS of GBX 47.5 per share at the end of the reporting period.
FUTR Stock Price Performance
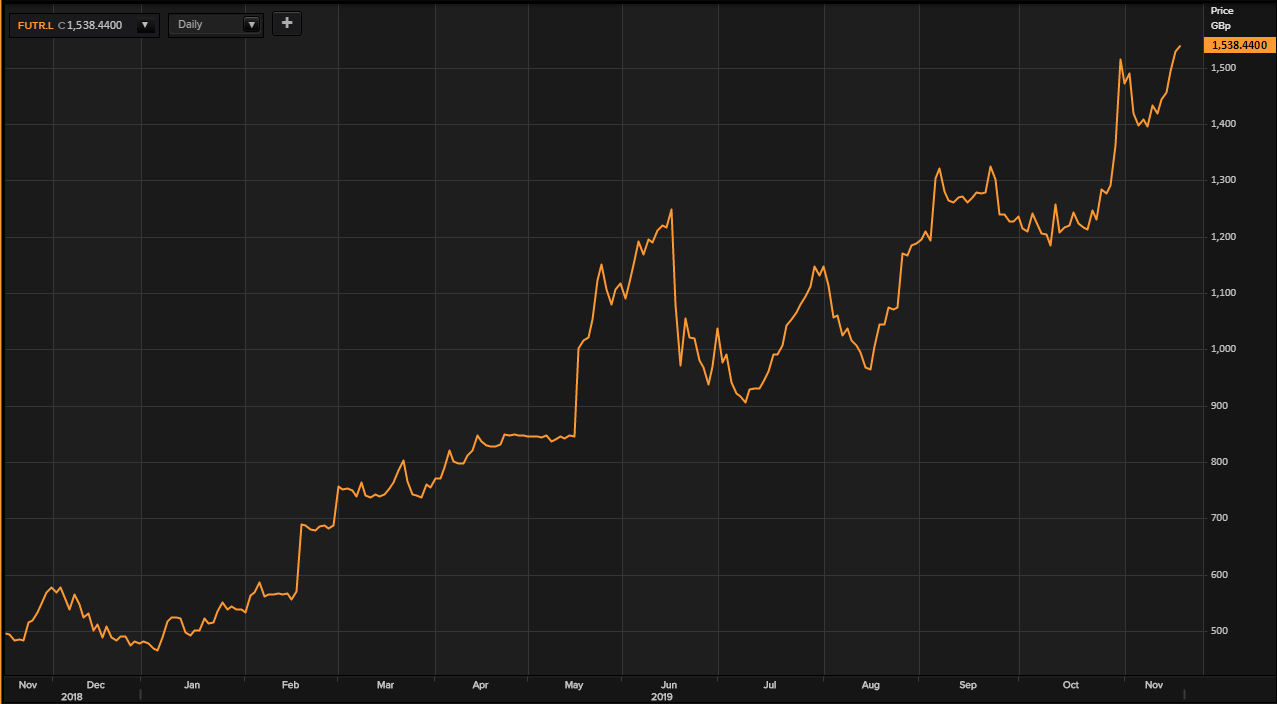
Daily Chart as at 19-November-19, before the market close (Source: Thomson Reuters)
On 19th November 2019, at 08:29 A.M GMT, While writing, Future Plcâs stock price has been reported to be trading at GBX 1538.44, an increase of 0.68 per cent or GBX 10.44 per stock as compared to the previous dayâs closing price, which was reported to be at GBX 1528.00. By the time of writing, the Future Plc stock was reported to have been trading 234.44 per cent above the 52-week low stock price, which was at GBX 460.00 per stock, that the companyâs stocks reached on January 07, 2019. This was also 1.76 per cent below the 52-week high price at GBX 1566.00 per stock, which the companyâs stock achieved on October 31, 2019. Future Plcâs reported market capitalisation (M-Cap) stands at a value of GBP 1.429 billion.
The average volume of trading per day for the companyâs stocks, for the last one year at the London Stock Exchange market, was 423,000 stocks. The stock has reportedly displayed a positive change of 211.43 per cent in value in the last one year, from the price of GBX 494.00 per stock. There also has been a positive movement in the last six months in the value of Future Plcâs stock of around 51.72 per cent from the stock price of GBX 1014.00 per stock. Future Plcâs stock has also reportedly gained 25.90 per cent in value in the last one month from the price of GBX 1222.00 per stock.
The beta of the Future Plcâs stock was reported to be at 0.86. Through this, it can be inferred that the companyâs stock price movement is less volatile in its trend, as compared to the benchmark market indexâs movement.
Fuller, Smith & Turner Plc
Fuller, Smith and Turner Plc (FSTA) is a bar and lodging company. Itâs working divisions include Tenanted Inns and fuse Managed Pubs and Hotels. The Managed Pubs and Hotels division oversees the pubs and supervised hotels, and also looks after the business of The Stable Pizza and Cider Limited.
FSTA Trading Statement
On 15th November 2019, the company announced a business update in which it reported that the business continued to trade well with total sales of the managed estate increasing by 5.2 per cent while the like-for-like sales growth was at 2.3 per cent for the 32 weeks ended 9th November 2019.
FSTA Stock Price Performance
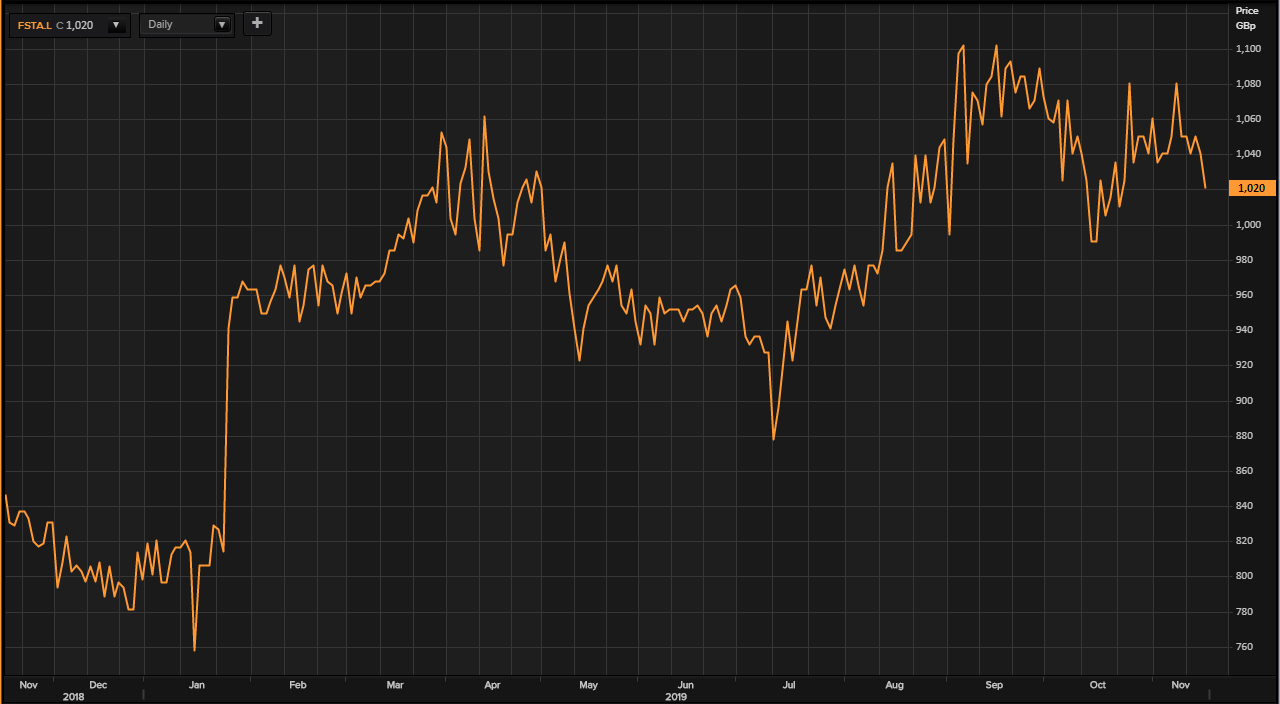
Daily Chart as at 19-November-19, before the market close (Source: Thomson Reuters)
On 19th November 2019, at 08:38 A.M GMT, while writing, Fuller, Smith & Turner Plcâs stock price has been reported to be trading at GBX 1020.00, no change in price as compared to the previous dayâs closing price. By the time of writing, the Fuller, Smith & Turner Plc stock was reported to have been trading 34.62 per cent above the 52-week low stock price, which was at GBX 757.69 per stock, that the companyâs stocks reached on January 16, 2019. This was also 8.93 per cent below the 52-week high price at GBX 1120.00 per stock, which the companyâs stock achieved on October 02, 2019. Fuller, Smith & Turner Plcâs reported market capitalisation (M-Cap) stands at a value of GBP 330.49 million.
The average volume of trading per day for the companyâs stocks, for the last one year on the London Stock Exchange market, was 22,950 stocks. The stock has reportedly displayed a positive change of 9.73 per cent in value in the last one year, from the price of GBX 929.52 per stock. There also has been a negative movement in the last six months in the value of Fuller, Smith & Turner Plcâs stock of around 5.12 per cent from the stock price of GBX 1075.00 per stock. Fuller, Smith & Turner Plcâs stock has also reportedly gained 1.49 per cent in value in the last one month from the price of GBX 1005.00 per stock.
The beta of the Fuller, Smith & Turner Plcâs stock was reported to be at 0.49. Through this, it can be inferred that the companyâs stock price movement is less volatile in its trend, as compared to the benchmark market indexâs movement.
