


Household Goods companies are those that are engaged in the development of the residential and used property. Home construction techniques had evolved from simple shelters to a vast array of living places.
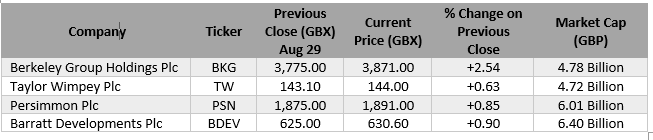
Below is the stock comparison of 4 LSE listed companies operating in the Household Goods sector
About Berkeley Group Holdings Plc
Berkeley Group Holdings PLC (BKG) is a Surrey, United Kingdom-headquartered holding company which is engaged in the development of the residential and used property across London, Birmingham and the South of England. The group is made up of six autonomous companies, namely St Joseph, St William, St Edward, Berkeley, St James, and St George, with each having its own operational management. The Berkeley group stock forms the part of FTSE 100 index.
Berkeley Group Holdings Plc Financial Highlights â Financial Year 2019 (£, million)
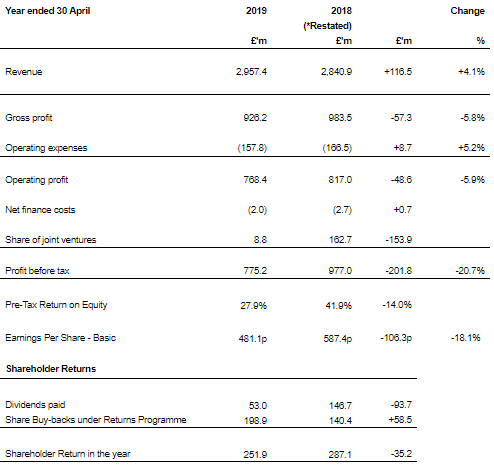
(Source: Annual Report, Company Website)
As 3,698 new homes were sold at an average selling price of GBP 748,000, revenue for the year rose to GBP 2,957.4 million in FY2019 versus GBP 2,840.9 million in FY2018, representing an increase of 4.1 per cent.
Gross profit declined by 5.8 per cent to GBP 926.2 million, and gross margin decreased to 31.3 per cent in FY2019 (2018: 34.6 per cent). Operating income fell by 5.9 per cent to GBP 768.4 million as operating expenses decreased by 5.2 per cent while operating margin decreased to 26.0 per cent from 28.8 per cent in FY2018.
Profit before tax fell by 20.7 per cent to GBP 775.2 million, corresponding to pre-tax return on equity of 27.9 per cent, compared to 41.9 per cent last year.
Basic earnings per share declined by 18.1 per cent from 587.4 pence in FY18 to 481.1 pence in FY19, and shareholder returns totalled GBP 251.9 million, which was 35.2 points lower than the last year.
Net assets rose over the year by GBP 0.4 billion, or 14.4 per cent, to GBP 2,963.3 million and net cash at the end of the year was GBP 975.0 million (30 April 2018: GBP 687.3 million).
Cash due on forward sales was GBP 1.8 billion (April 2018: GBP 2.2 billion), and net asset value per share was up by 18.9% to GBP 23.05 (April 2018: GBP 19.38).
Berkeley Group Holdings Plc Share Price Performance
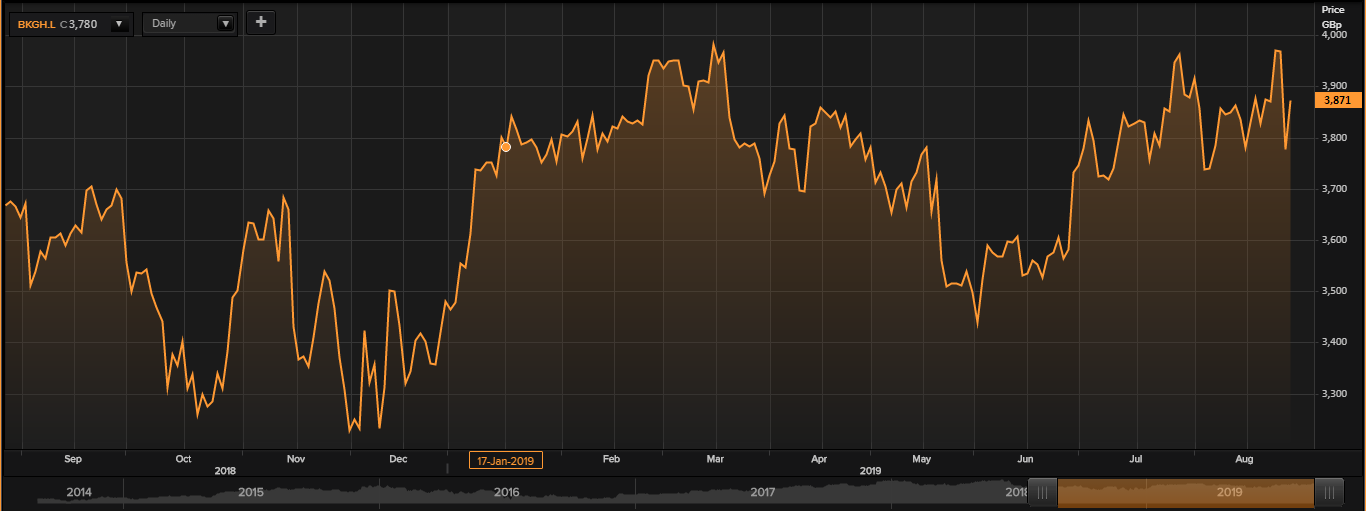
Daily Chart as at 29-August-19, before the market close (Source: Thomson Reuters)
On 29 August 2019, at the time of writing (before the market close, GMT 3:03 PM), Berkeley Group Holdings Plc shares were trading at GBX 3,871.00, up by 2.54% against the previous dayâs closing price. Stock's 52 weeks High and Low is GBX 4,012.00/GBX 3,170.00.
About - Taylor Wimpey Plc
Taylor Wimpey PLC (TW) is a United Kingdom-based residential housing developer which operates at a regional level from 24 local offices across the country. It is one of the UK's largest residential developers and builds a wide range of properties, with a broad price range. The companyâs operations are differentiated in two geographical segments: Housing United Kingdom and Housing Spain. The Housing United Kingdom segment is further sub-divided into North, Central and South West, London and South East (including Central London) and Corporate.
Taylor Wimpey Plc Financial Highlights â H1 Financial Year 2019 (£, million)
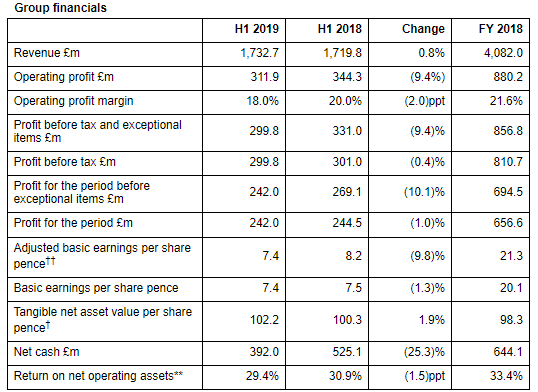
(Source: Interim Report, Company Website)
In the First half of the financial year 2019, the companyâs revenue surged by 0.8 per cent to £1,732.7 million as against £1,719.8 million in H1 FY2018. In H1 FY2019, the company completed 6,541 homes versus 6,497 homes in H1 FY2018.
The companyâs operating profit declined by 9.4 per cent from £344.3 million in H1 FY2018 to £311.9 million in H1 FY2019. The decline in operating profit was driven by an increase in build costs and geographic mix.
The companyâs PBT (Profit before tax) stood at £299.8 million in H1 FY2019 versus £301.0 million in H1 FY2018. The Profit for the period was at £242 million in H1 FY2019 as against £244.5 million in H1 FY2018.
The companyâs adjusted basic earnings per share were 7.4 pence in H1 FY2019 versus 8.2 pence in H1 FY2018. The companyâs basic earnings per share were 7.4 pence in H1 FY2019 versus 7.5 pence in H1 FY2018.
Taylor Wimpey Plc Share Price Performance
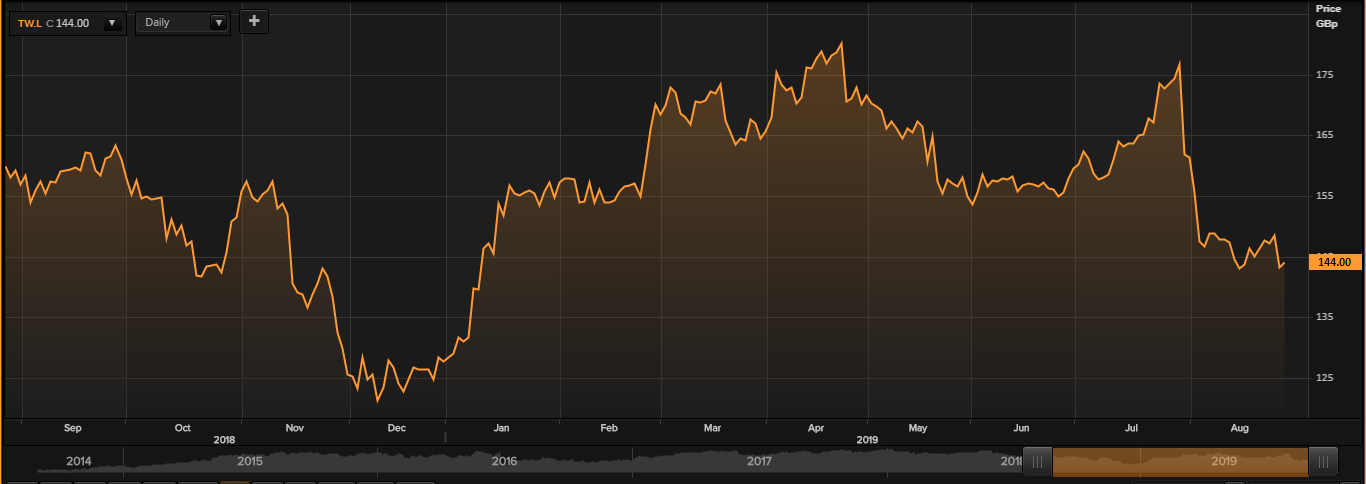
Daily Chart as at 29-August-19, before the market close (Source: Thomson Reuters)
On 29 August 2019, at the time of writing (before the market close, GMT 3:05 PM), Taylor Wimpey Plc shares were trading at GBX 144.00, up by 0.63% against the previous dayâs closing price. Stock's 52 weeks High and Low is GBX 180.51/GBX 119.72.
About - Persimmon Plc
Persimmon Plc (PSN), a leading housebuilder company of UK is headquartered in York. The company is listed on the London Stock Exchange and is a part of FTSE 100. The company designs, develops and builds residential houses, with offers ranging from studio apartments to executive-style family homes, providing a wide range of homes across 400 locations, along with its offsite manufacturing capabilities.
Persimmon Plc Financial Highlights â H1 Financial Year 2019 (£, million)
(Source: Interim Report, Company Website)
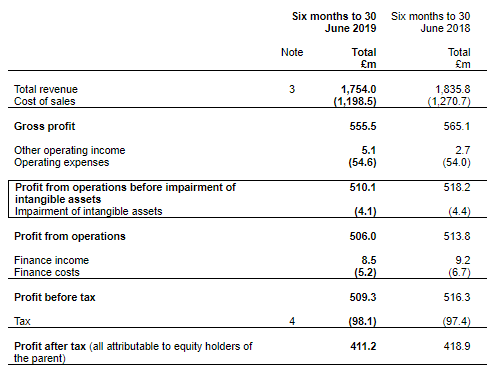
The group sold 7,584 (2018: 8,072) new homes in the first half at an average selling price of GBP 240,000 (H1 2018: GBP 215,813), leading to a fall of 5.6 per cent in new housing revenues to GBP 1,645.3 million (H1 2018: GBP 1,742.0 million), while total revenues for the first half of the year were 4.5 per cent lower at GBP 1,754.0 million (H1 2018: GBP 1,835.8 million).
Underlying gross profit was GBP 555.5 million (H1 2018: GBP 565.1 million), representing a gross margin of 33.8 per cent (H1 2018: 32.4%), while total gross margin for the first half was 31.7 per cent (H1 2018: 30.8 per cent).
Operating profit for the period was GBP 506 million against GBP 513.8 million in the prior period, while underlying operating profit was 1.6 per cent lower than last year at GBP 510.1 million (H1 2018: GBP 518.2 million). This resulted in an increase of 130 basis points in the underlying new housing operating margin to 31.0 per cent, though it was lower than 31.8 per cent reported in H2 2018.
Underlying basic earnings per share of 130.6 pence reduced by 4.2 per cent as compared to the prior year (H1 2018: 136.3 pence), while total basic earnings per share reduced from 134.9 pence in H1 2018 to 129.3 pence in the latest period.
Underlying return on average capital employed as at 30 June was 40.5 per cent (H1 2018: 41.7 per cent) and return on equity was reported at 31.0 per cent for the current period (June 2018: 30.2 per cent).
Persimmon Plc Share Price Performance
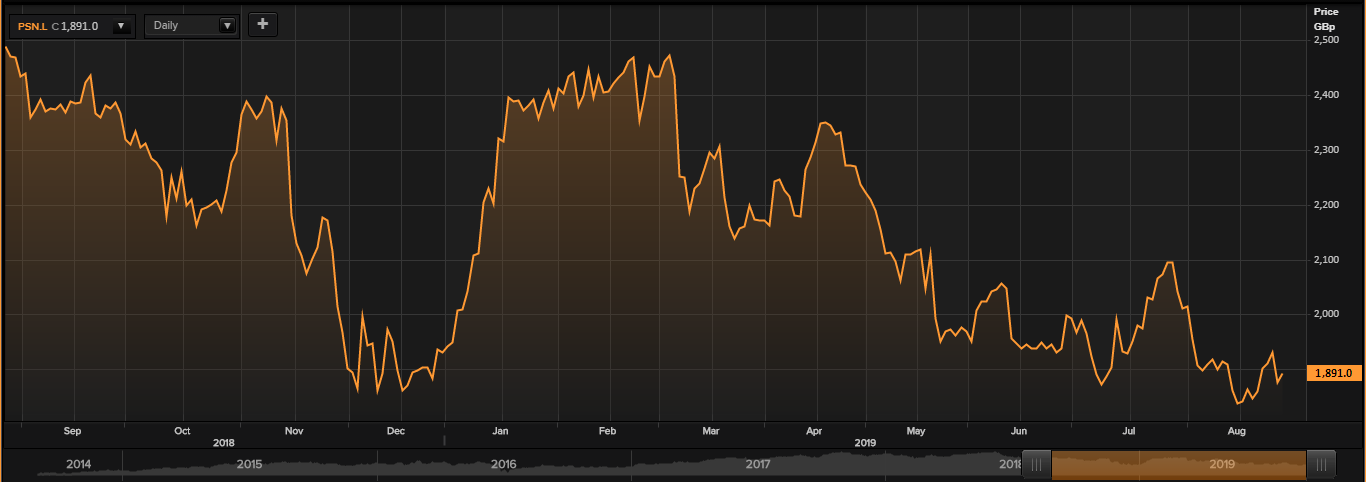
Daily Chart as at 29-August-19, before the market close (Source: Thomson Reuters)
On 29 August 2019, at the time of writing (before the market close, GMT 3:08 PM), Persimmon Plc shares were trading at GBX 1,891.00, up by 0.85% against the previous dayâs closing price. Stock's 52 weeks High and Low is GBX 2,495.43/GBX 1,802.50.
About - Barratt Developments Plc
The United Kingdom-based Barratt Developments Plc (BDEV) is a holding company engaged in the business of acquiring land, planning, designing, developing, constructing and selling the residential property and commercial property as well. The group's business operations are Housebuilding and Commercial developments. Major brands of the company are Barratt Homes, David Wilson Homes and Barratt London.
Barratt Developments Plc Trading Update
The company announced a trading update for the financial year ended 30th June 2019 and its annual results would be announced on 4th September 2019. Total homes completed including joint ventures increased to 17,856 homes as compared with the financial year 2018 of 17,579 homes, wholly-owned completions increased by 2.6 per cent to 17,111 homes against the previous year data.
Operating margin surged to 18.9 per cent, with an underlying margin of approximately 70bps, due to the margin initiatives. Profit before tax projected to be increased from market expectations at approximately £910 million against the £835.5 million in FY18, due to the additional contribution from joint ventures, continued solid progress from margin initiatives, and a strong close to the year.
For the 10th year in a row, the company awarded the HBFâs (Home Builders Federation) maximum 5 Star customer satisfaction rating. On 30th June 2019, total forward sales, including JVs, increased to £2,604.1 million against the £2,175.7 million in FY2018.
Barratt Developments Plc Financial Highlights - H1 Financial Year 2019 (£, million)
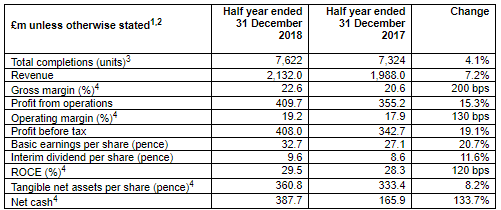
(Source: Interim Report, Company Website)
The groupâs total completions for the period increased by 4.1 per cent in the first half of FY 2019 to 7,622 homes, against 7,324 homes in H1 FY18, which was in line with the groupâs expectations. The revenue increased by 7.2 per cent in H1 FY19 to £2,132 million, up from £1,988 million in the H1 of FY18.
The Gross margin improved by 200 basis points to 22.6% in H1 FY19 as compared with 20.6% in H1 FY18. The operating margin also rose by 130 bps to 19.2 per cent, reflecting higher gross margins of new land purchased and the benefits of the new product range.
The PBT (profit before tax) surged by 19.1 per cent to £408 million in H1 FY2019 from £342.7 million in H1 FY2018.
The basic earnings per share rose by 20.7 per cent to 32.7 pence. The return on capital employed grew from 28.3 per cent to 29.5 per cent in H1 FY19.
Barratt Developments Plc Share Price Performance
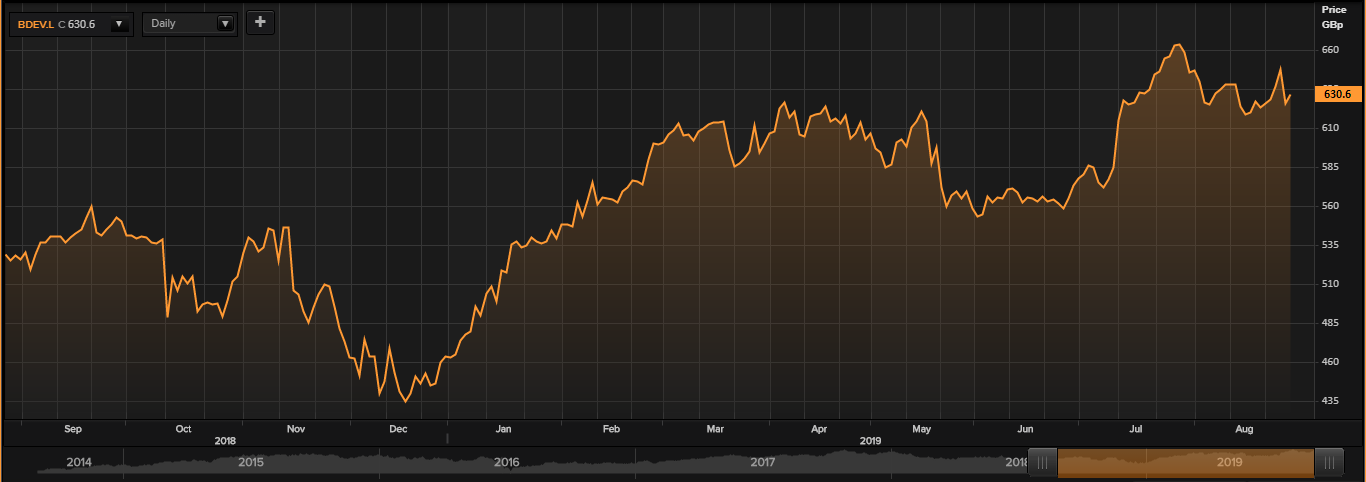
Daily Chart as at 29-August-19, before the market close (Source: Thomson Reuters)
On 29 August 2019, at the time of writing (before the market close, GMT 3:11 PM), Barratt Developments Plc shares were trading at GBX 630.60, up by 0.9% against the previous dayâs closing price. Stock's 52 weeks High and Low is GBX 670.20/GBX 430.00.
