


Energean Oil & Gas PLC
Energean Oil & Gas Plc (Identifier: ENOG) is an oil and gas exploration and production company that produces crude oil and natural gas. The companyâs activities include exploration, production and development of oil and natural gas properties. Energeanâs gas platform includes onshore plant with storage, offshore loading, desulphurisation and power generation facilities. The company operates its offices in Greece, Cyprus, Israel, the UK, Montenegro and Egypt.
ENOG-Recent developments
On 4th November 2019, the company declared the successful appraisal of the Karish North Discovery. Â It has confirmed estimates of 34 million barrels of light condensate/oil in addition to 25 BCM (0.9 Tcf) of gas.
Â
ENOG-Financial highlights for H1 FY19
In the first half of the financial year 2019, the companyâs revenue rose by 52.1 per cent to $40 million as compared with the H1 FY18 data of $26.3 million. Revenue in H1 FY19 increased on account of higher realised prices and volumes. The gross profit for the period stood at $11,401 thousand versus $8,482 thousand in H1 FY2018. Adjusted EBITDAX stood at $23.6 million in H1 FY2019, an increase of 41.3 per cent against the $16.7 million in H1 FY2018. With the increase in the administrative expenses and the exploration expenses for the period, the companyâs operating profit declined by 62.2 per cent to $3.85 million in H1 FY2019 from $10.2 million in H1 FY2018. The companyâs PBT (Profit before tax) declined by 103.8 per cent to negative $3.1 million in H1 FY2019 from PBT (Profit before tax) of $82.1 million in H1 FY2018. The companyâs reported loss for the period stood at $4,488 thousand in H1 FY2019 versus a profit for the period of $87,400 thousand in H1 FY2018.
The basic loss per share stood at $0.03 in H1 FY2019 versus basic earnings per share of $0.81 in H1 FY2018.
The diluted loss per share stood at $0.03 in H1 FY2019 versus diluted earnings per share of $0.80 in H1 FY2018.
The capital expenditure for the period stood at $346.9 million versus $105.5 million in H1 FY2018, up by 228.9 per cent.
Although the companyâs revenue increased in H1 FY2019, the bottom-line performance declined significantly. With the increase in expenses for the current period, the companyâs profitability has entered a negative zone.
The company has reduced its production guidance for the financial year 2019 to 3,400 bopd - 3,600 bopd from 4,300 bopd - 4,800 bopd. The companyâs expected cost of production will rise in 2019 due to higher commodity input prices and local inflation.
ENOG-Share price performance
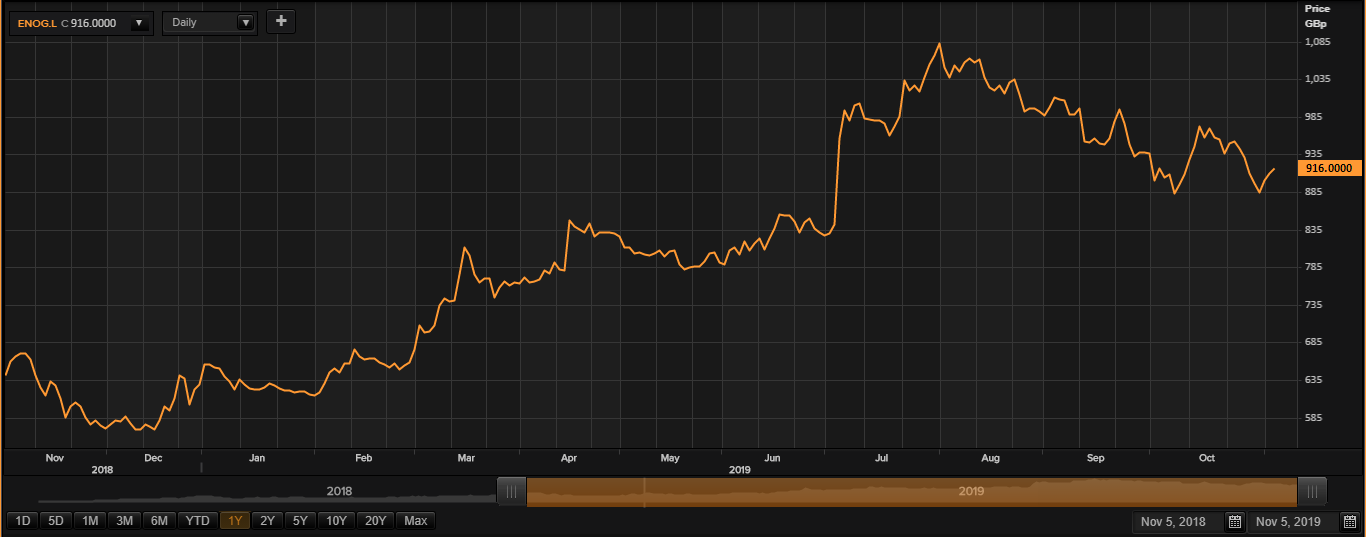
(Source: Thomson Reuters)
While writing (as on 05th November 2019, at 11:21 AM GMT), Energean Oil & Gas Plc shares were trading at GBX 916 per share, up by 0.77 per cent as compared to the previous day closing price level. The companyâs market capitalisation was around £1.61 billion.
ENOG shares have clocked a high of GBX 1,092.00 (as on 01st August 2019) and a low of GBX 540.00 (as on 17 December 2018) in the past year. At the current price point, as quoted in the price chart, the companyâs shares were trading 16.11 per cent below the 52-week high price point and 69.62 per cent above the 52-week low price point.
At the time of writing, the stockâs volume before the market close, stood at 12,035. Stock's average daily traded volume for 5 days was 137,948.40; 30 days- 147,414.47 and 90 days â 203,072.99. The companyâs stock beta (2Y weekly) was 0.65, which makes it less volatile as against the benchmark index.
The average daily traded volume for 5 days plunged by 6.42 per cent as against 30 days average daily traded volume. At the time of writing, the shares of the company were trading below the 30-day and 60-day SMA.
In the past 1 month, ENOG shares have delivered positive return of 0.55 per cent. Also, on a YTD (Year-to-Date) time interval, the stock surged by approximately 44.68 per cent and was down by 13.43 per cent in the last three months.
The stock's RSI (Relative Strength Index) for the 30-day, 14-day and 9-day were recorded at 45.15, 43.40 and 43.11 respectively. Also, the stockâs 3-day RSI was recorded at 55.51.
Union Jack Oil PLC
United Kingdom-based Union Jack Oil PLC (Identifier: UJO) is an onshore gas and oil production and exploration company. The group aims at the development, production, drilling, and investment in the hydrocarbon sector. The companyâs main projects consist of Wressle, Burton on the Wolds, Biscathorpe, and North Kelsey.
UJO-Financial highlights for H1 FY19
In the first half of 2019, the reported revenue increased to £76,409 against the £73,044 in H1 FY18. Net loss for the first half of 2019 stood at £484,068, an increase in loss from the corresponding period of last year. Basic and diluted loss per share stood at 0.01 pence and remained the same as compared to the corresponding period of the previous year. The company was fully funded for all testing and drilling requirements. The company also remained debt-free.
The company for the first half of 2019 has generated decent revenue growth and its profitability metric is in the negative zone.  The companyâs activities are exposed to financial risk, liquidity risk, oil price risk, credit risk, and cash flow risk.
A mixed movement in the commodity prices may negatively impact the economic viability and profitability of the companyâs projects. The oil prices in the international market have slightly improved with fluctuation seen for other commodities.
The company operates in a challenging environment which requires continuous investment, sometimes at the cost of profitability, to stay ahead of competitors. The company has a higher degree of threat due to future exploration, development and production uncertainties.
UJO-Share price performance
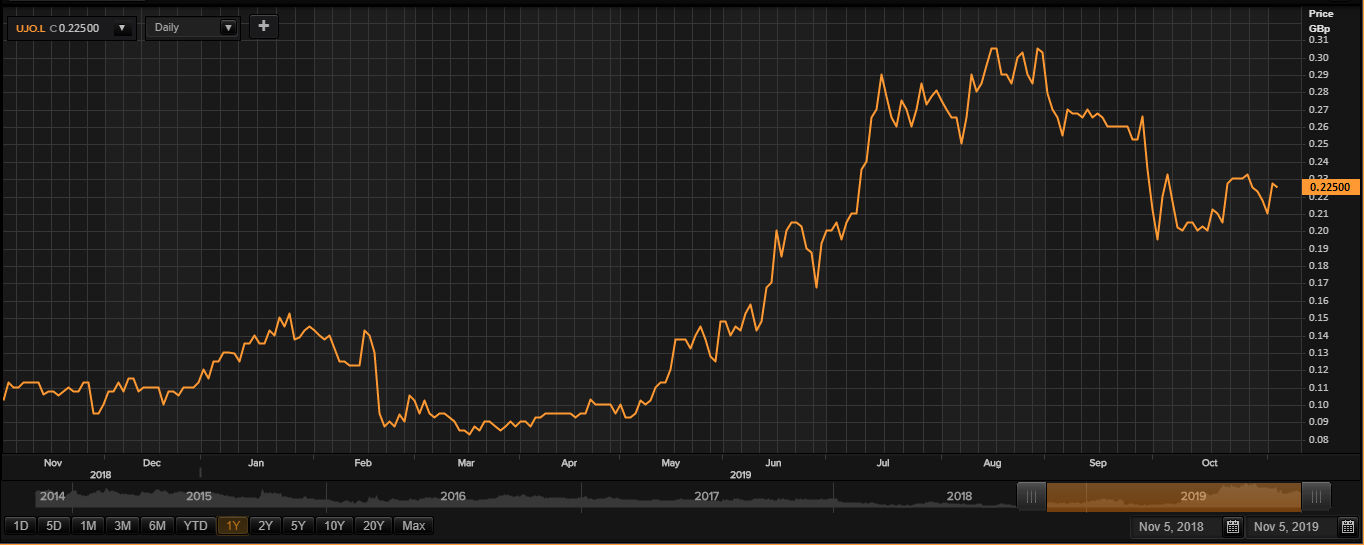
(Source: Thomson Reuters)
While writing (as on 05th November 2019, at 11:26 AM GMT), Union Jack Oil PLC shares were trading at GBX 0.225 per share, down by 1.09 per cent as compared to the previous day closing price level. The companyâs market capitalisation was around £27.54 million.
UJO shares have clocked a high of GBX 0.38 (as on 29th August 2019) and a low of GBX 0.076 (as on 20 March 2019) in the past year. At the current price point, as quoted in the price chart, the companyâs shares were trading 40.78 per cent below the 52-week high price point and 196.05 per cent above the 52-week low price point.
At the time of writing, the stockâs volume, before the market close, stood at 1,187,074. Stock's average daily traded volume for 5 days was 2,415,184.00; 30 days- 2,378,187.33 and 90 days â 2,752,553.88. The companyâs stock beta (5Y monthly) was 0.19, which makes it less volatile as against the benchmark index.
The average daily traded volume for 5 days plunged by 36.84 per cent as against 30 daysâ average daily traded volume. At the time of writing, the shares of the company were trading above the 30-day and 200-days SMAs.
In the past 1 month, UJO shares have delivered negative return of 2.15 per cent. Also, on a YTD (Year-to-Date) time interval, the stock surged by approximately 102.22 per cent and was down by 15.74 per cent in the last three months.
The stock's RSI (Relative Strength Index) for the 30-days, 14-days and 9-days were recorded at 48.91, 51.22 and 55.21 respectively. Also, the stockâs 3-days RSI was recorded at 65.99.
