


Augmentum Fintech Plc
Closed-ended investment company, Augmentum Fintech Plc (LON:AUGM) is a closed-ended investment company, which looks forward to invest in fintech businesses in early stages and later-stages. These investment opportunities identified by the company are focused on disruptive products and technologies in the financial services sector and other cross-industry proposition. The portfolio of the company is managed by Augmentum Fintech Management Limited. The companyâs portfolio consists of partnerships, unquoted companies, limited liability partnerships (LLPâs) and other legal forms of entity. The company aims for capital appreciation over the long period through an interest in an array of strategic, aligned investment instruments and securities which have good foundation and potential, specifically, innovation-driven Fintech companies based in the United Kingdom and Europe.
AUGM-Update on Interim results
The interim results of the company for the period ended 30th September 2019 are delayed.
AUGM-Fundamentals snapshot
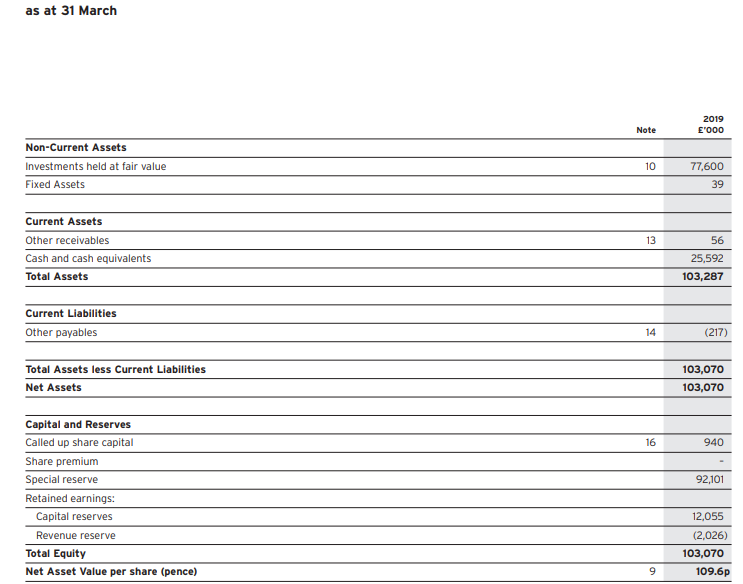
(Source: Annual report, Companyâs website)
The companyâs investments held at fair value were recorded at £77,600 thousand in FY19. The net assets of the company were valued at £103,070 thousand in FY19.
AUGM-Share price performance
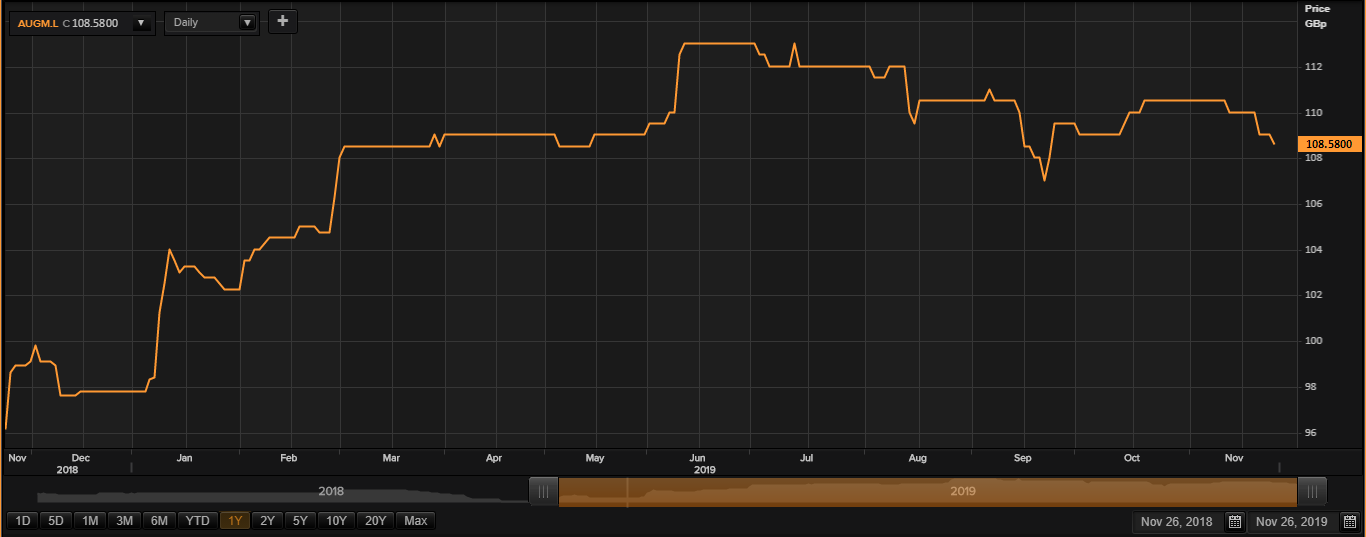
Daily Chart as at Nov-26-19, before the market close (Source: Thomson Reuters)
On 26th November 2019, at the time of writing (before market close, GMT 10:53 AM), AUGM shares were trading at GBX 108.58. Stock's 52 weeks High and Low is GBX 116.00/GBX 96.26. Stockâs average daily traded volume for 5 days was 262,549.20; 30 days - 194,873.47 and 90 days - 127,676.44. The daily average traded volume for 5 days was up by 34.73% as compared to 30 days average traded volume. The total M Cap (market capitalisation) was around £126.91 million.
Caledonia Investments Plc
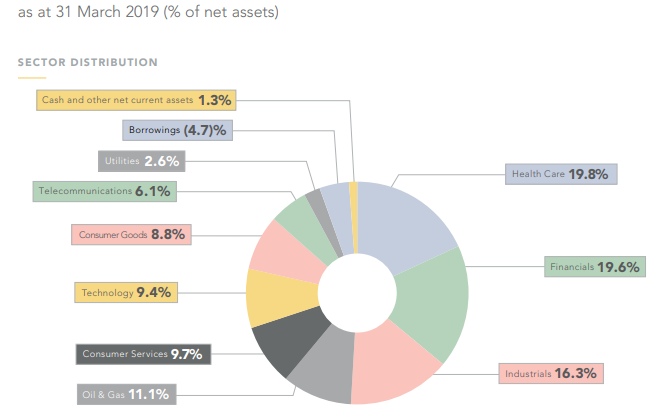
Self-managed investment trust, Caledonia Investments Plc (LON:CLDN) aims to deliver long-haul growth, in terms of capital appreciation and income generation for shareholders, by investing in a mix of asset classes with a balanced risk meter, across sectors and geographies. The investment company looks forward to established entities rather than new businesses to reap better return on capital employed in the longer time horizon. The investment portfolio of the company is a good mix of open-ended funds, listed and private companies, private equity, structured products, limited partnerships and other investment vehicles in diversified sectors and regions. The sector allocation varies from basic materials, consumer goods, consumer services, healthcare, industrials, financials, industrials, oil and gas, telecommunications, and others. The geographic allocation includes Asia Pacific, Continental Europe, North America and the United Kingdom.
CLDN-Recent news
The company released its results for the first half of the financial year 2019 period ended 30th September 2019 today, i.e. 26th November 2019.
CLDN-Business performance for H1 FY19
The company reported satisfactory results over the half-year, with a net asset value per share total return of 4.9 per cent for the period.
The companyâs investment income was marginally ahead of the comparable period last year, standing at £23.9 million. The net cash of the company was recorded at £6.3 million by the end of H1 FY19. The management of the company has declared an interim dividend of 16.6p per share, which was 3.1 per cent more in comparison to the previous year.
The companyâs net assets were valued at £2,077 million as at 30th September 2019.
CLDN-Share price performance
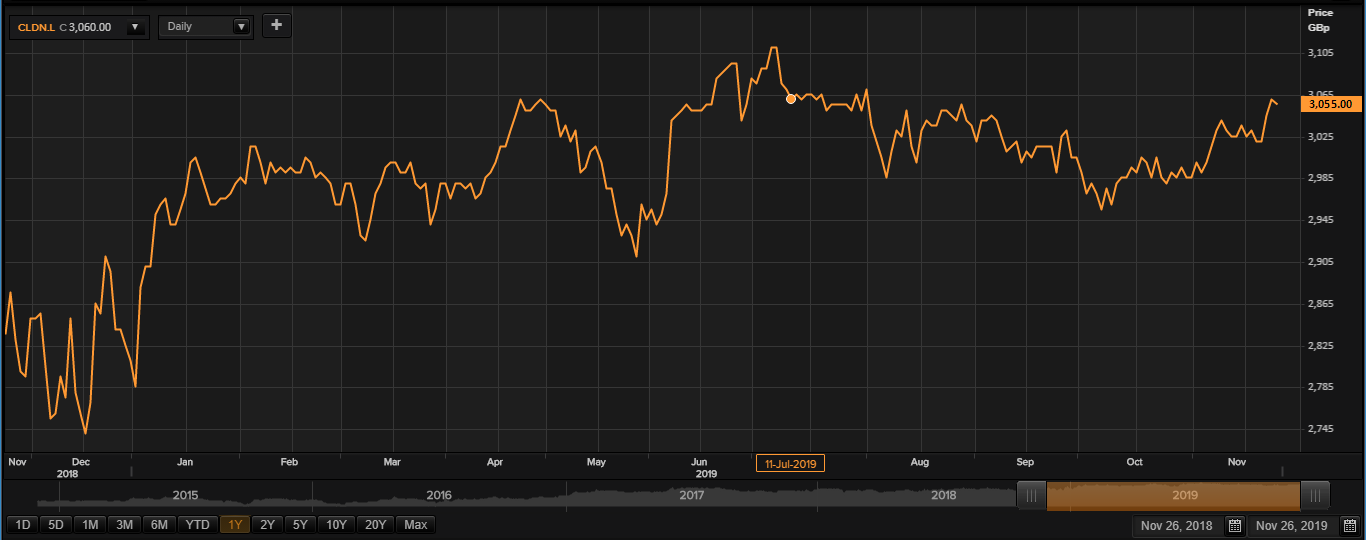
Daily Chart as at 26-Nov-2019, before the market close (Source: Thomson Reuters)
On 26th November 2019, before market close (at the time of writing, GMT 10:56 AM), CLDN shares were trading at GBX 3,055.00. Stock's 52 weeks High and Low is GBX 3,129.12/GBX 2,705.00. Stockâs average daily traded volume for 5 days was 17,078.00; 30 days - 24,311.03 and 90 days - 29,180.77. The daily average traded volume for 5 days was down by 29.75% as compared to 30 days average traded volume. The companyâs stock beta was 0.46, reflecting lower volatility as compared to the benchmark index. The total M Cap (market capitalisation) was around £1.64 billion.
Â
The European Investment Trust Plc
The European Investment Trust Plc (LON:EUT) is an investment company, Â which aims to achieve capital appreciation in the long term through investment in European securities diversified across sectors such as basic materials, consumer goods, consumer services, healthcare, industrials, financials, industrials, oil and gas, and many other. The geographic allocation of the companyâs investment portfolio includes the Netherlands, Norway, Spain, Sweden, Switzerland, Denmark, Finland, France, Germany, Ireland, and Italy. The portfolio of the company is managed by Edinburgh Partners Limited, Â and its alternative investment fund is managed by Edinburgh Partners AIFM Limited.
(Source: Interim report, Companyâs website)
Â
EUT-Business performance for H1 FY19
The companyâs shareholderâs funds stood at £366.6 million in first-half of the fiscal year 2019 as against £414.3 million in the first half of the fiscal year 2018. The companyâs NAV/share stood at 907.6 pence in the first half of the fiscal year 2019 as against 1004.3 pence in the first half of the fiscal year 2018. The companyâs Revenue return per ordinary share stood at 7.9 pence in the first half of the fiscal year 2019 as against 8.4 pence in the first half of the fiscal year 2018. The companyâs interim dividend per share stood at 9.5 pence in the first half of the fiscal year 2019 as against 9 pence in the first half of the fiscal year 2018.
EUT-Share price performance
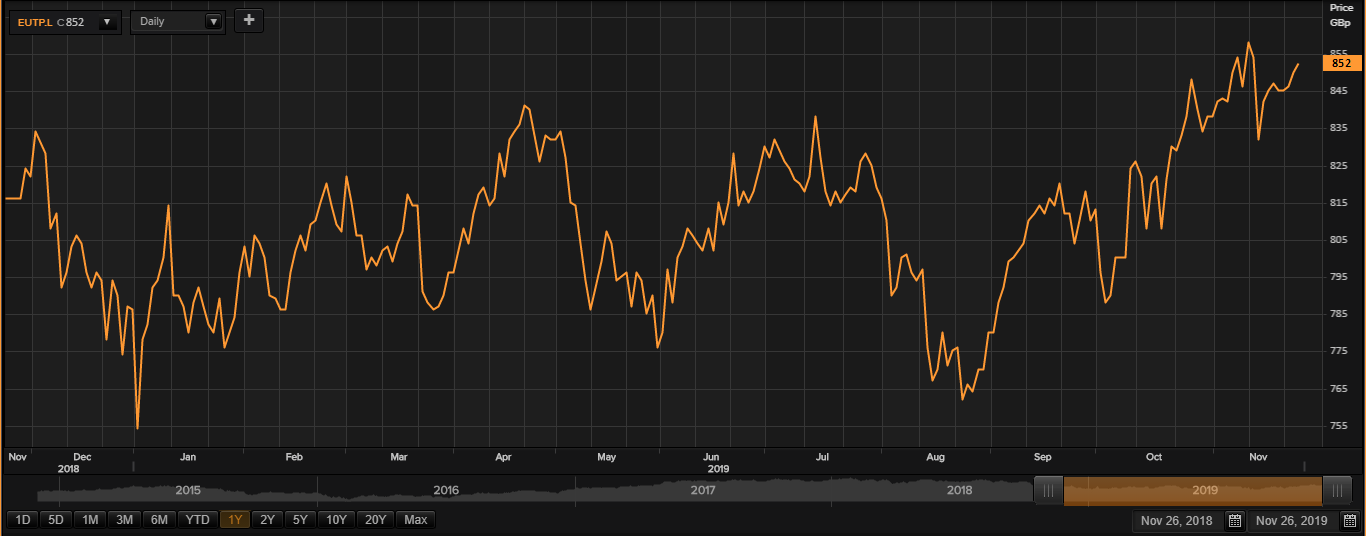
Daily Chart as at Nov-26-19, before the market close (Source: Thomson Reuters)
On 26th November 2019, at the time of writing (before market close, GMT 11:00 AM), EUT shares were trading at GBX 852. Stock's 52 weeks High and Low is GBX 860.16/GBX 748.00. Stockâs average daily traded volume for 5 days was 18,938.80; 30 days - 41,179.57 and 90 days - 37,909.83. The daily average traded volume for 5 days was down by 54.01% as compared to 30 days average traded volume. The companyâs stock beta was 1.04, reflecting more volatility as compared to the benchmark index. The total market capitalisation was around £340.27 million.
Paragon Banking Group PLC
Financial services group, Paragon Banking Group Plc (LON:PAG) is a debt purchaser and holds secured and unsecured consumer loan portfolios. The company manages its business activities through three divisions, namely, Idem Capital, Paragon Bank and Paragon Mortgages. The revenue stream generated from debt purchases and loan administration activities is managed by the Idem Capital. The income generated from regular banking and acquisition of asset management companies is managed by Paragon Bank, while the revenue stream generated from ancillary functions, in the form of interest from mortgages and other assets is managed by Paragon Mortgages. The group was earlier known as The Paragon Group of Companies PLC.
PAG-Recent news
The company released its results for the financial year 2019 period ended 30th September 2019 on 26th November 2019.
PAG-Business performance for FY19
The companyâs underlying profits surged by 5.0 per cent to £164.4 million in the fiscal year 2019 as compared to £156.5 million in the fiscal year 2018. Due to increase in both net interest margins and loan balances, the companyâs net interest income surged by 8.5 per cent on an underlying basis at £278.4 million in the fiscal year 2019 and surged by 9.3 per cent on a statutory basis.
The companyâs cost to income ratio on a statutory basis was 40.7 per cent in the Financial Year 2019 as against 37.8 per cent in the Financial Year 2018. The disposal of Idem Capital portfolio in 2018 led to gain of £28.0 million, translated to statutory profit before tax of £159.0 million in the fiscal year 2019. The groupâs underlying EPS increased by 6 per cent to 51.1 pence per share in the Financial Year 2019 as compared to 48.2 pence per share in the Financial Year 2018. The company has gained a decent position in the market and looks forward to good earnings and profitability.
PAG-Share price performance
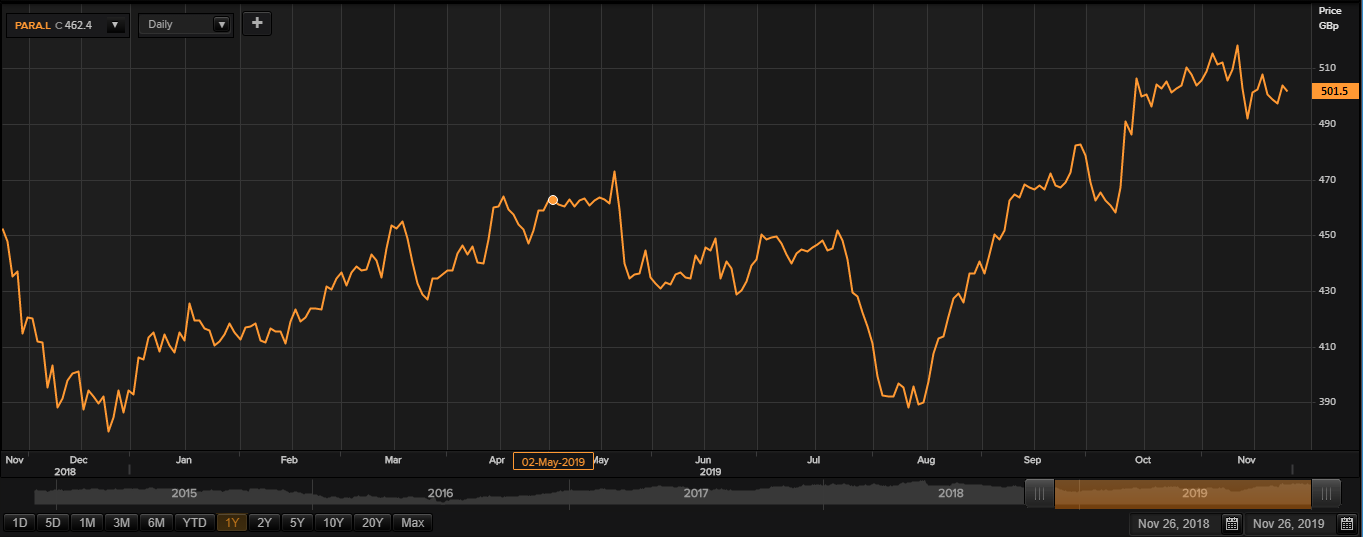
Daily Chart as at Nov-26-19, before the market close (Source: Thomson Reuters)
On 26th November 2019, at the time of writing (before market close, GMT 11:04 AM), PAG shares were trading at GBX 501.50. Stock's 52 weeks High and Low is GBX 518.00/GBX 379.20. Stockâs average daily traded volume for 5 days was 248,771.60; 30 days - 360,025.27 and 90 days - 493,443.31. The daily average traded volume for 5 days was down by 30.90% as compared to 30 days average traded volume. The companyâs stock beta was 0.95, reflecting lower volatility as compared to the benchmark index. The total M Cap (market capitalisation) was around £1.28 billion.
