

_07_03_2026_03_50_21_133108.jpg)


BAE Systems Plc (LON:BA) Â
BAE Systems Plc is the United Kingdom-based leading defence, aerospace and security company with operations spread across the world. The group delivers a broad range of advanced defence technology that covers air, land, naval forces and cyber domain, including critical infrastructure and information security. The company has an employee base of more than 85,000 people spread in 40 plus countries.
BA-Business performance for H1 FY19 period ended 30th June 2019
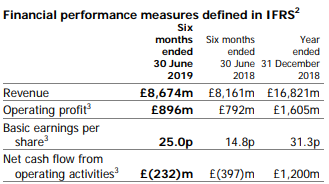
(Source: Half-yearly report, Companyâs website)
The revenue of the group post-IFRS adoption was recorded at £8,674 million at the end of the period. The operating profit was recorded at £896 million by the end of H1 FY19. The dividend declared by the group increased to 9.4 pence per share in H1 FY19 from 9 pence per share in H1 FY18.
BAE Systems-Stock price performance
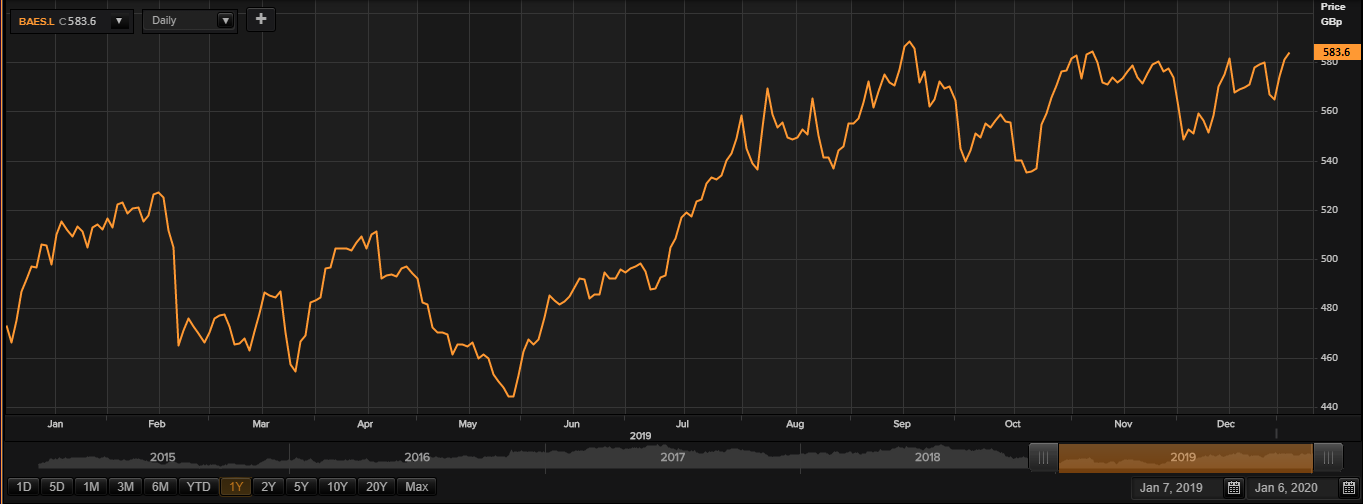
Daily Chart as at Jan-06-20, before the market close (Source: Thomson Reuters)
On 06th January 2020, at the time of writing (before market close, GMT 9:16 AM), BAE Systems Plc was trading at GBX 583.60, up by 0.48 per cent against its previous day closing price. Stock's 52 weeks High and Low is GBX 590.80 /GBX 439.40. At the time of writing, the share was trading 1.22% lower than its 52w High and 32.82% higher than its 52w low.
The average traded volume for 5 days was down by 30.52% as compared to 30 days average traded volume. The companyâs stock beta was 1.10, reflecting higher volatility as compared to the benchmark index. The outstanding market capitalisation was around £18.62 billion. Stockâs daily average traded volume for 5 days was 3,056,278.80; 30 days - 4,398,984.27 and 90 days - 5,518,919.91.
Just Eat Plc (LON: JE.)
Just Eat Plc is an online food order and delivery service company based in the UK. It provides an online marketing platform for independent food take-out joints on the one hand, and for customers it provides the convenience of choosing between multiple foods, take-out service vendors, placing order online and receiving the delivery. The company divided its business into five market segments namely, the United Kingdom market, the Australian market, the New Zealand market, established markets (Benelux, Canada, Denmark, France, Ireland, Norway and Switzerland) and Developing markets (Italy, Mexico and Spain). The companyâs shares are listed for trading on the London Stock Exchange, where they trade with the ticker name JE. The companyâs shares are also components of the FTSE 100 Index.
Just Eat-Business performance for H1 FY19 period ended 30th June 2019
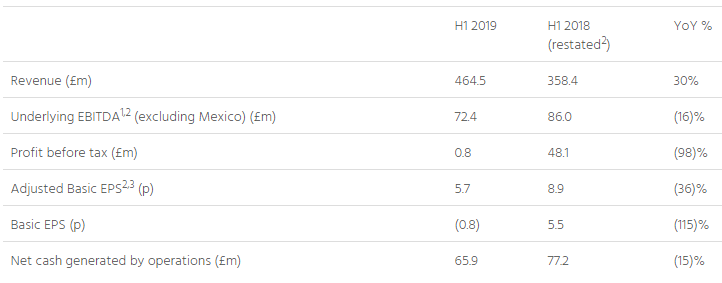
(Source: Companyâs website)
The Revenue of the group was up by 30 per cent to £464.5 million in H1 FY19 as compared to £358.4 million in H1 FY18. The Profit before taxation of the company was down by 98 per cent to £0.8 million in H1 FY19 as compared to £48.1 million in H1 FY18. The orders went up by 21 per cent to 123.8 million in H1 FY19 in contrast to 102.5 million in H1 FY18.
Just Eat-Stock price performance
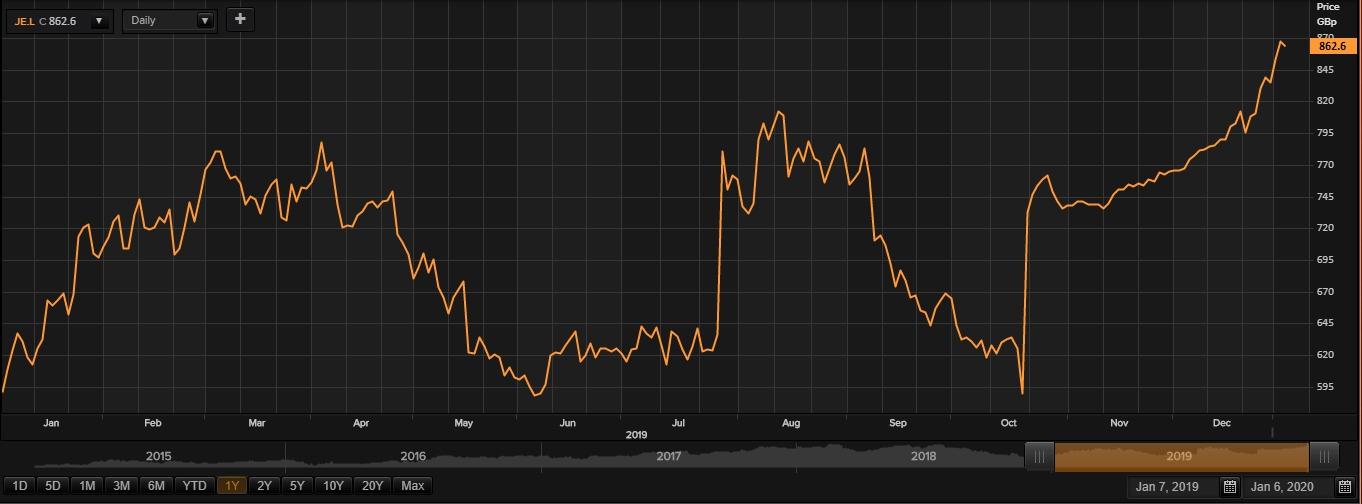
Daily Chart as at Jan-06-20, before the market close (Source: Thomson Reuters)
On 06th January 2020, at the time of writing (before market close, GMT 9:20 AM), Just Eat Plc was trading at GBX 862.60, down by 0.51 per cent against its previous day closing price. Stock's 52 weeks High and Low is GBX 878.00 /GBX 574.40. At the time of writing, the share was trading 1.75% lower than its 52w High and 50.17% higher than its 52w low.
The average traded volume for 5 days was down by 16.46% as compared to 30 days average traded volume. The companyâs stock beta was 1.27, reflecting higher volatility as compared to the benchmark index. The outstanding market capitalisation was around £5.92 billion. Stockâs daily average traded volume for 5 days was 3,207,547.40; 30 days - 3,839,594.33 and 90 days - 2,893,695.47.
Vistry Group Plc (LON:VTY)
London Stock Exchange-traded Vistry Group Plc is a Home Construction company, with operational interests in designing, building and sale of the house for both private customers and registered social landlords. The group is a constituent company of mid-cap gauge FTSE 250. The group was recently renamed to Vistry Group Plc from Bovis Homes Group PLC (LON:BVS).
VTY-Business performance for H1 FY19 period ended 30th June 2019
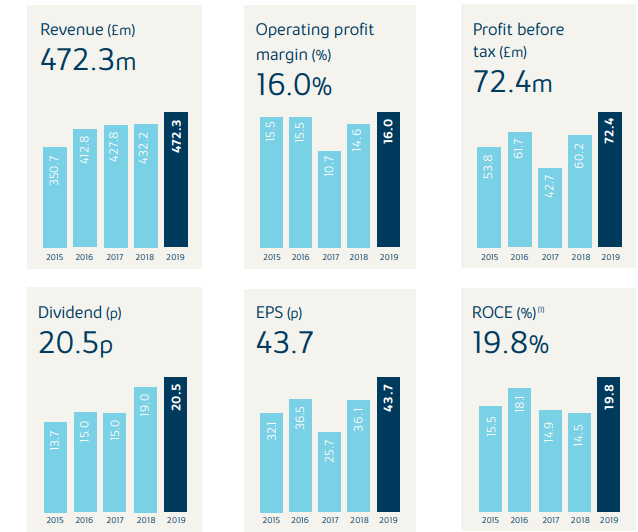
The revenue of the company was recorded at £472.3 million in the first half of the fiscal year 2019. The profit before taxation of the company was recorded at £72.4 million in the first half of the fiscal year 2019. The company declared a dividend of 20.5 pence during the period.
(Source: Half-yearly report, Companyâs website)
Vistry Group-Stock price performance
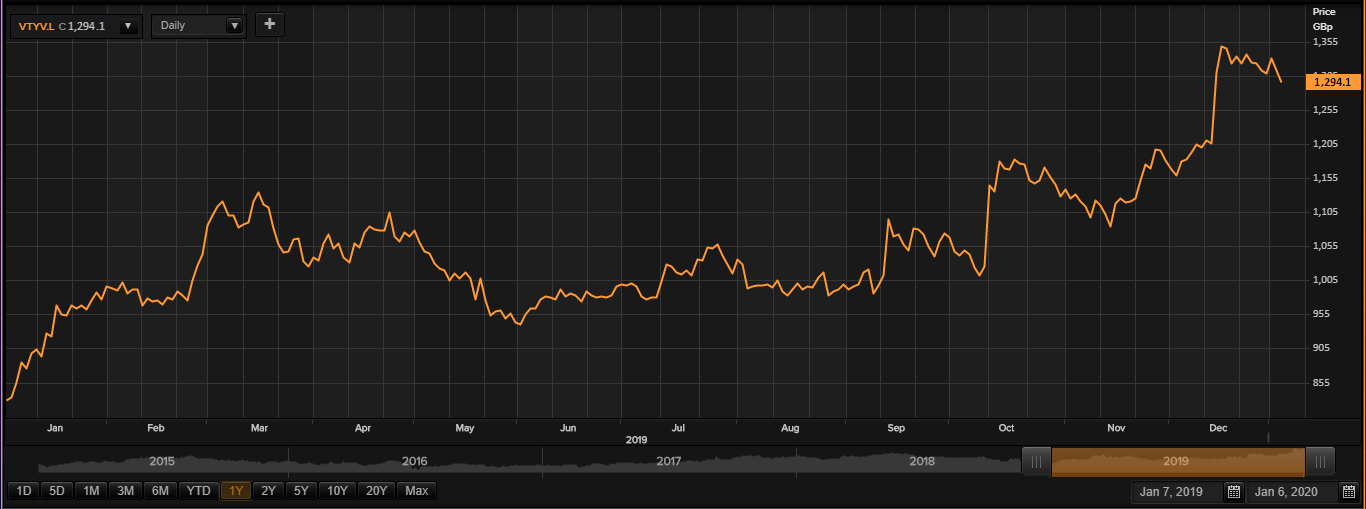
Daily Chart as at Jan-06-20, before the market close (Source: Thomson Reuters)
On 06th January 2020, at the time of writing (before market close, GMT 9:26 AM), Vistry Group Plc was trading at GBX 1,294.10, down by 1.36 per cent against its previous day closing price. Stock's 52 weeks High and Low is GBX 1,350.96 /GBX 820.66. At the time of writing, the share was trading 4.21% lower than its 52w High and 57.69% higher than its 52w low.
The average traded volume for 5 days was down by 35.92% as compared to 30 days average traded volume. The companyâs stock beta was 1.01, reflecting almost similar volatility as to the benchmark index. The outstanding market capitalisation was around £2.86 billion. Stockâs daily average traded volume for 5 days was 361,819.51; 30 days - 564,648.39 and 90 days - 471,673.05.
Bodycote Plc (LON:BOY)
Bodycote Plc , founded in 1923 is an Industrial Engineering group providing subcontract thermal processing services globally. The group presently operates in 180 plus locations with a representative base of 5,600 plus professionals worldwide. The group through, its expertise, deliver reliable, cost-effective and high-quality solutions to its clients. It operates in two main areas: the automotive & general industrial (AGI) business and the aerospace, defence & energy (ADE) business. In 1972, the group was listed on the London Stock Exchange.
Bodycote PLC Business performance for H1 FY19 period ended 30th June 2019
(Source: Companyâs filings, LSE)
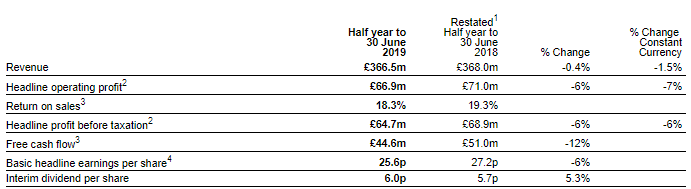
The revenue of the company was recorded at £366.5 million in H1 FY19. The operating profit of the company stood at £64.4 million in H1 FY19. The profit before taxation of the company was recorded at £62.2 million in H1 FY19. The company declared an interim dividend of 6 pence per share during the period.
Bodycote Plc -Stock price performance
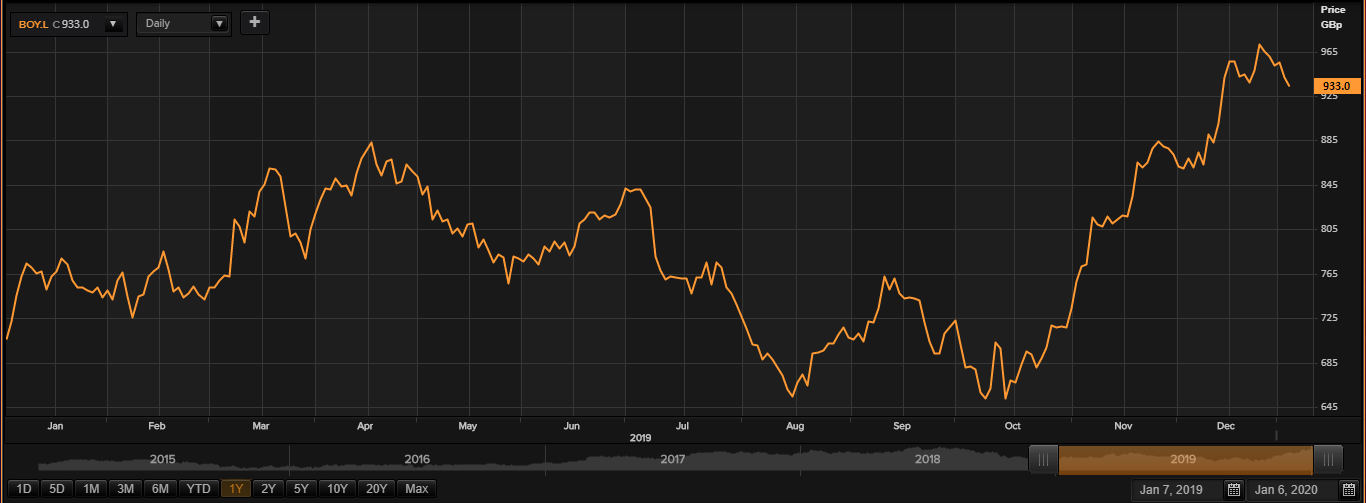
Daily Chart as at Jan-06-20, before the market close (Source: Thomson Reuters)
On 06th January 2020, at the time of writing (before market close, GMT 9:28 AM), Bodycote Plc was trading at GBX 933, down by 0.85 per cent against its previous day closing price. Stock's 52 weeks High and Low is GBX 975.00 /GBX 638.50. At the time of writing, the share was trading 4.31% lower than its 52w High and 46.12% higher than its 52w low.
The average traded volume for 5 days was down by 69.66% as compared to 30 days average traded volume. The companyâs stock beta was 1.41, reflecting higher volatility as compared to the benchmark index. The outstanding market capitalisation was around £1.80 billion. Stockâs daily average traded volume for 5 days was 118,618.80; 30 days - 390,937.90 and 90 days - 367,328.82.
Galliford Try Plc (LON:GFRD)
Galliford Try Plc is a British housebuilding, regeneration, and construction company, headquartered in Uxbridge, London. It was formed in the year 2000 through the merger of Galliford and Try Group. Try Group was founded in London by WS Try in the year 1908. Thomas Galliford started Galliford Plc group in the year 1916. The company is one of the leading construction company in the UK and is a part of the FTSE 250 index. The company helps in meeting the demand for new homes in the private and budget homes segment, regenerates neighbourhoods.
GFRD-Business performance for FY19

(Source: Companyâs filings, LSE)
The group revenue of the company was recorded at £2,711 million for FY19. The profit before taxation of the group was recorded at £104.7 million in FY19. The annual dividend of the company stood at 58 pence per share for FY19.
Galliford Try PLC -Stock price performance
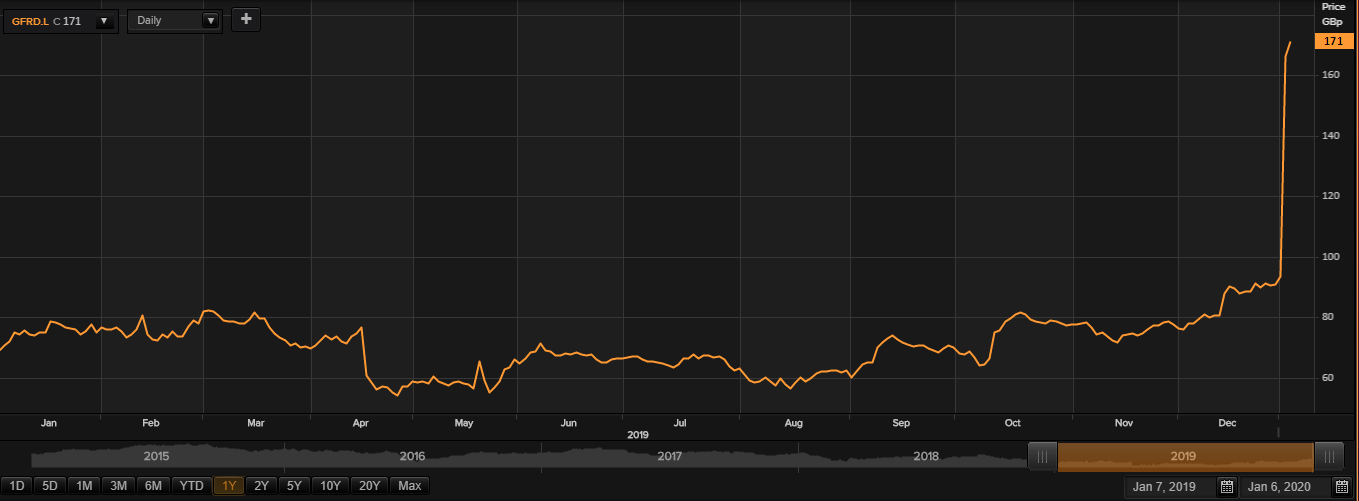
Daily Chart as at Jan-06-20, before the market close (Source: Thomson Reuters)
On 06th January 2020, at the time of writing (before market close, GMT 9:37 AM), Galliford Try Plc was trading at GBX 171, up by 3.10 per cent against its previous day closing price. Stock's 52 weeks High and Low is GBX 887.00/GBX 103.00. At the time of writing, the share was trading 80.72% lower than its 52w High and 66.02% higher than its 52w low.
The average traded volume for 5 days was up by 134.80% as compared to 30 days average traded volume. The companyâs stock beta was 1.03, reflecting higher volatility as compared to the benchmark index. The outstanding market capitalisation was around £184.19 million. Stockâs daily average traded volume for 5 days was 1,302,802.60; 30 days - 554,845.30 and 90 days - 588,419.62.
