


Source: pcruciatti, Shutterstock
Summary
- JPMorgan Chase & Co. (NYSE:JPM) hit a new lifetime high and delivered a return of ~27 percent in the last three months.
- JPM Stock prices are trading in a rectangle channel formation on the daily chart.
- The stock price is trading in a rising channel formation on the weekly time frame chart and getting major support from the 50-period SMA.
The stock price is facing strong resistance around the upward sloping trendline JPMorgan Chase & Co. (NYSE:JPM) price has witnessed a sharp rally from the low of USD 127.35 made in January 2021 to the recent all-time high of USD 161.69 level hit on 18 March 2021, a gain of ~27 percent in the last 3 months. The prices have been moving in the rectangle channel formation for the past one month on the daily chart and trading in the range of USD 146.50 - USD 157.90.
JPM on a daily chart
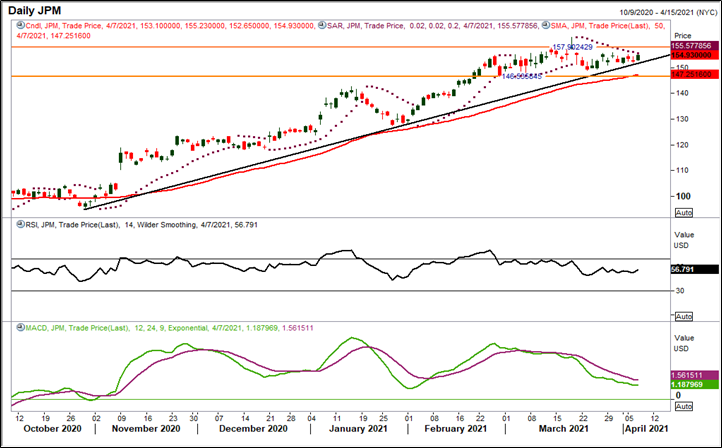
Source: EODHD/Others, Thomson Reuters; Analysis: Kalkine Group
The stock price is trading in a strong upward trajectory, forming series of higher tops and higher bottoms which indicate bulls are still in action. The prices are trading above the upward sloping trendline support level of USD 151 (black color horizontal line in the above chart) and continuously taking support of it.
Besides, the price is trading above its 50-period SMA, acting as a crucial support zone at the lower end of the channel pattern. The momentum oscillator RSI (14-period) is trading at ~56.79 levels, indicating a positive trend for the stock. MACD is also trading above the centerline, which indicates a positive stance for the stock. However, the price is trading below its Parabolic SAR indicator acting as immediate resistance for the stock.
JPM on a weekly chart
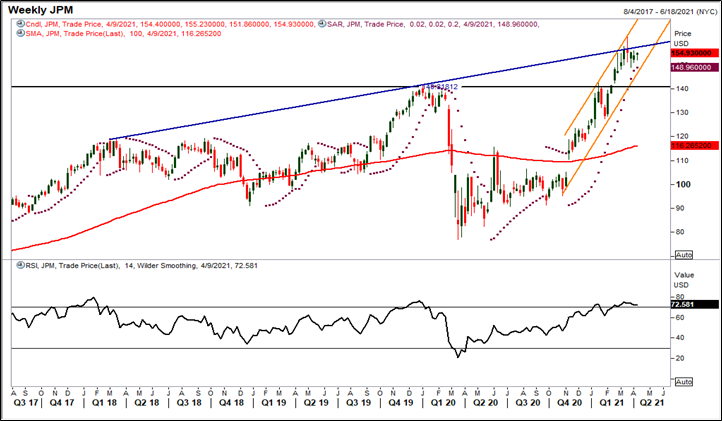
Source: EODHD/Others, Thomson Reuters; Analysis: Kalkine Group
the stock prices are trading in a sharp rising channel formation for the past seven months and currently, the prices are sustaining around the lower band of the channel pattern. The stock has broken-out of its horizontal trend line (black color horizontal line in the above chart) at USD 140.80 level on February 16, 2021 and after that made a new lifetime high. Prices also broke the upward sloping trend line on the upside (blue color line in the above chart) at USD 157.10 level but the bulls were unable to hold above the breakout level and the prices drifted towards the lower band of the channel pattern.
Furthermore, the prices are trading above the Parabolic SAR indicator, acting as an immediate support zone for the stock. The price is well placed above its 100-period SMA, acting as the important support for the stock at the lower end.
However, the momentum oscillator RSI (14-period) is trading in the overbought zone at ~72.58 levels, indicating that a correction from here may drift the price lower towards the support zone. The major resistance level for the stock price is at USD 157.40 level.
Based on the above chart analysis and technical outlook, JPMorgan Chase & Co. price seems to be in an uptrend. Currently, the stock prices are holding the key support zone. As per the chart pattern analysis, that there might be some action expected in JPM if the price breaks the important support levels.
