
.jpg)


Summary
- NASDAQ 100 Technology Sector Index made a fresh lifetime high.
- The Technology Index is trading near the important resistance level and delivered ~17.66 percent return in the last three months.
- S&P 500 Energy Sector Index breaks out of an inverse head and shoulders pattern and bulls are finding crucial support around the 21-period simple moving average (SMA)
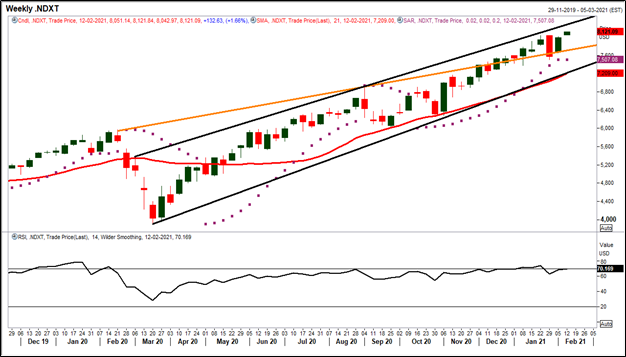
On the weekly chart, NASDAQ 100 Technology Sector Index has broken out of its upward trend line (orange line in the below chart) at 7,560.70 and made a new lifetime high of 8,121.84 (as on 08 February 2021). The index price is trending upward, forming a series of higher tops and higher bottoms which indicates bulls are still in action. The index has been on a strong uptrend for the past six weeks from the low of 7,375.45. On the weekly time frame chart, the tech index has been trading in the rising channel for the past few months.
NASDAQ 100 Technology Sector Index trades within a channel
Source: EODHD/Others, Thomson Reuters; Analysis: Kalkine Group
Currently the index prices are hovering near the upper band of the rising channel formation. If the bulls failto break the above resistance level of 8,280.40, then prices revert back towards the upward sloping trend line. Moreover, the index is trading above the Parabolic SAR indicator, acting as a crucial support zone at 7,507.08 level.
The index is well placed above its 21-period SMA, providing strength to the trend. However, the momentum oscillator RSI (14-Period) is trading near the overbought zone at ~70.20 levels, indicating that a correction from here may drift the price lower towards the support zone. The major resistance level for the index is at 8,255.40, any sustainable move above this level might attract more bullish sentiments ahead for the prices.
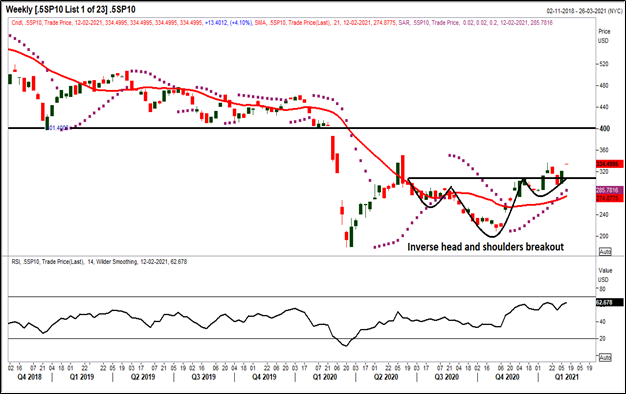
S&P 500 Energy Sector Index to take out the inverse head and shoulders pattern?
Source: EODHD/Others, Thomson Reuters; Analysis: Kalkine Group
The S&P 500 Energy Sector Index has broken an ‘Inverse Head & Shoulders’ (bullish reversal) pattern at 318.50 level on the weekly chart, and after that price touched the 3-week high of almost 334.50. After consolidating in the range of 281.60 – 313.40 for more than 2 months, the price registered a decisive breakout that suggests a change in trend from sideways to bullish.
Further, the index is trading in a double bottom formation for the last one-year and currently, the price is approaching towards the neckline of the double bottom formation. The upside resistance is at 353.50 level and in the short run, if the index price sustains above the neckline breakout level of 353.50 then bulls might dominate and are expected to remain active till the next resistance level of 401.40, near the horizontal trend line.
In addition, the index is trading above its 21-periodSMA, acting as a crucial support zone at the lower end of the pattern. The index is well placed above its Parabolic SAR, which appears positive for the uptrend. Furthermore, the momentum oscillator RSI (14-Period) is trading at ~62.68 levels, which supports bullish bias for the index. Based on the above-presented chart analysis and technical outlook, the NASDAQ 100 Technology Sector Index appears to be under the control of bulls from the past few months but currently hovering near major resistance zone whereas, the S&P 500 Energy Sector Index is currently moving above the pattern breakout. There might be some action in S&P 500 Energy Sector Index if the price remains above the support zone or breaks the crucial resistance zone in the coming months.
