


Highlights
- A superbubble is created when prices of several asset classes go through the roof simultaneously.
- Finally, the time has come for central banks around the world to start tightening the monetary supply.
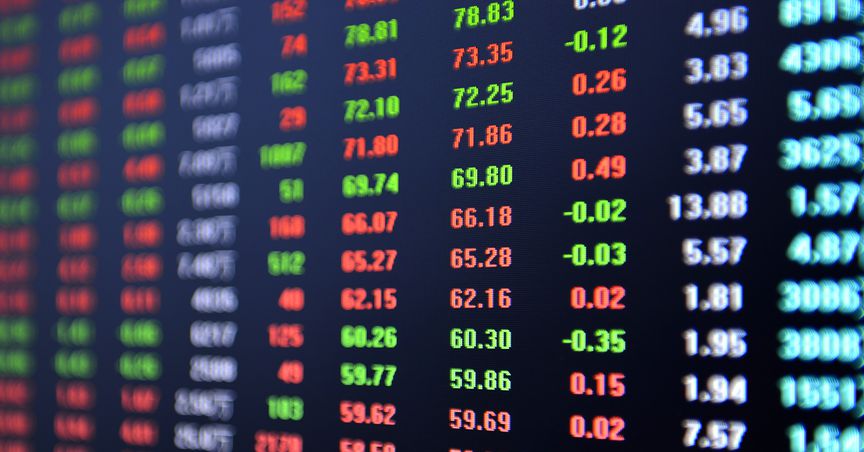
- The Dow Jones is down 6.34% for the year, while the broader market index S&P 500 has fallen 8.31% YTD.
Legendary British investor Jeremy Grantham recently made headlines when he said that the US market is in a ‘superbubble’.
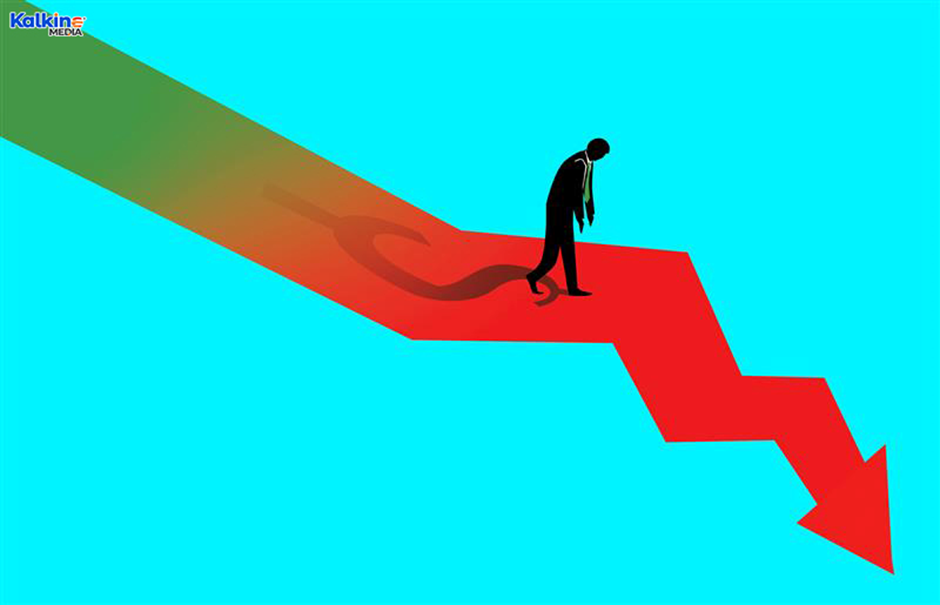
Image Source: © 2022 Kalkine Media®
A bubble in the financial markets is referred to a euphoria or a buying frenzy wherein the price of an asset class rises exponentially within a relatively short span of time. A superbubble, on the other hand, is created when prices of several asset classes go through the roof simultaneously.
So, is the US market on the verge of a collapse?
First thing to be noted is that the US is the largest economy in the world. Also, as today’s world is a globalised one, whatever happens in the US, its impact is felt across various economies. The bull market that started just after the financial meltdown in March 2020, seems to have topped out, and might have a limited run, at least for some time now.
Why are we saying this? Well, it seems like it is finally the time for central banks around the world to start tightening the monetary supply, which was the most important factor behind the rally. The unprecedented move of quantitative easing had flooded the economies with cash that eventually trickled into financial markets, leading to a sharp bull run.
However, the side-effect of excess money supply, i.e., inflation has starter to creep in now, which in turn, calls for the tightening of the monetary stimulus. The sell-off going on in the US and global markets is probably what the market participants are discounting ahead of the first rate hike after the pandemic. The Dow Jones is down 6.34% for the year, while the broader market index S&P 500 has fallen 8.31% YTD. Tech stocks have been taking the hardest hit, with NASDAQ 100 tumbling by double digits or 12.5% so far.
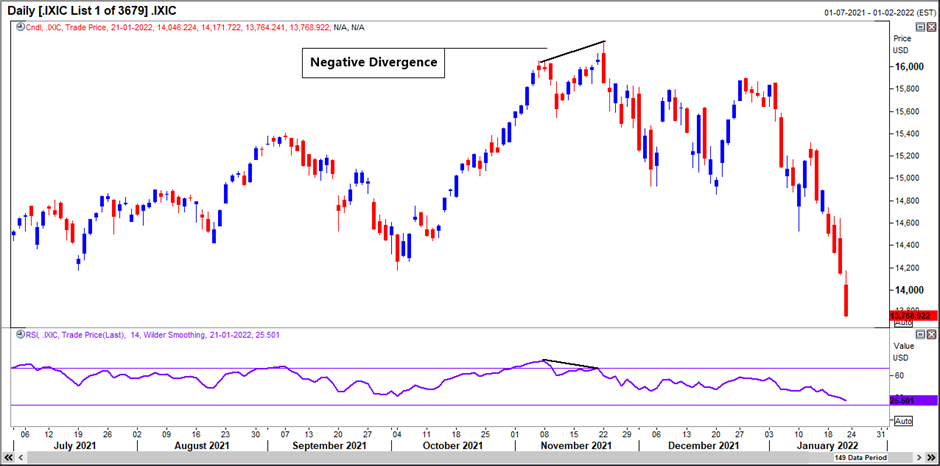
Image Description: Daily price chart of NASDAQ Composite with a negative divergence at the top
Image Source: EODHD/Others
Also, technical charts aren’t painting a rosy picture either. Looking at the chart of three major Wall Street indices, all of them have formed a negative divergence which signals a reversal towards south. A bearish divergence takes place when the underlying security makes a higher high but the respective oscillator fails to replicate the same, or in other words, isn’t able to make a higher high.
According to the Dow theory, if all major indices of a stock market move in the same direction, it confirms the ongoing trend, again increasing the reliability of a top being formed.
