


Bitcoin prices are finally taking a breather after witnessing two consecutive worst weeks since its rally began in March 2020.
Also Read: Ether At All-time High; Outperforming Bitcoin, Things You Should Know!
Speculative Reasons Behind the Recent Plunge
A sudden and a sharp decline in the digital currency attracted many speculations with some even quoting the increase in ‘double spent’ to be the reason while some are also attributing the fall to the public denouncement of Bitcoin by Janet Yellen – nominee for Treasury Secretary in the United States President Joe Biden’s administration.
However, many speculations currently in the market do not make much sense as linking such a small correction in prices to double spent rather looks a bluff. It is to be noted that Bitcoin is believed to be free from manipulation, thanks to the open ledger – Blockchain.

Image Source: Megapixl
Double spent is described as a process where a sender tricks a recipient into accepting a transaction, which is actually sent to the sender himself, and any occurrence of such an instance in the blockchain could lead to a panic sell-off, and last week’s fall certainly did not look like a panic sell.
Also, this could also be confirmed by looking at the number of coins into the system, which remained the same, contrasting to what was supposed to happen if double spent did take place. On the parallel side, no new coins were added to the system.
Meanwhile, the fall halted on the technical side following a breakdown of a consolidation.
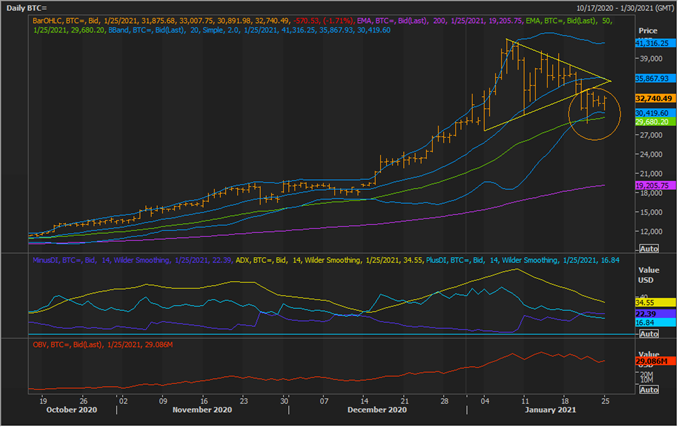
Bitcoin Daily Price Chart (Image Source: EODHD/Others Eikon Thomson Reuters)
Bitcoin on Charts
On following the daily BTC price chart, it could be seen that the currency slipped below the bottom line of a symmetrical triangle pattern, reflecting a consolidation break. However, soon the currency found its support around the -2 Standard Deviation of the 20-day simple Bollinger Band®, which is overlapping with the 50-day exponential moving average. Therefore, might act as immediate support for the currency.
- While the currency witnessed a consolidation break, a divergence in the On Balance Volume suggests that the recent sell-off was not followed by large volumes. Thus, the slip below the consolidation range could also be a specialist breakout.
- Another observation, which is supporting the possibility of a specialist breakout below the symmetrical triangle is a sharp decline in the Average Directional Index (ADX), reflecting that the current downfall is not trending in nature.
- However, the price behaviour outside the symmetrical triangle (encircled on the above chart) is showing some negative behaviour, which could seed bearish sentiments ahead.
- On following the recent price bars, it could be seen that a pattern of outside bar followed by an inside bar is seen, and the currency has now breached the low of the inside bar.
