
.jpg)


Summary
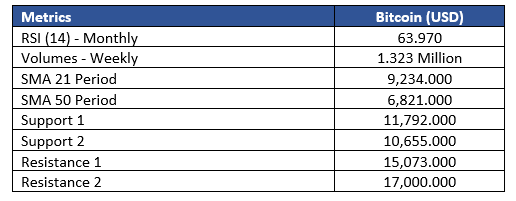
- Bitcoin:(BTC) prices broke the symmetric triangle pattern on a monthly chart and is now getting stiff resistance around USD 14,000 levels which also lie over 138.6% Fibonacci retracement level.
- BTC prices are currently trading at USD 13,439 at the time of writing.
- Bitcoin is witnessing positive correlation with S&P 500 index prices.
- Bitcoin price seasonality for last 5 years suggests sluggish demand in the period of January to March, demanding investor attention during the first quarter of 2021.
Bitcoin :(BTC) Back in the News: Will it be able to sustain the recent rally?
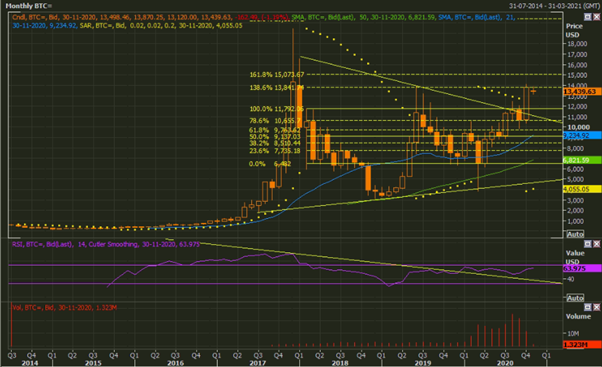
Chart Source: Thomson Reuters EODHD/Others
On technical charts, Bitcoin broke the symmetric triangle pattern in the month of October. Prices are currently facing stiff resistance at 138.6% retracement level after breaking the previous high seen in June 2019 As per theory, one could say that the prices might take correction up to USD 11,792 and USD 10,655 in the coming months if the resistance level holds.
However, it is to be noted that Bitcoin prices are not getting volume support with increase in prices on a monthly time frame, signalling bulls are losing grip on the market.
Bitcoin prices are trading above 50-period and 21-period simple moving averages on a monthly time frame, reflecting that the primary trend is an uptrend.
Technical Indicators: RSI (14) is hovering around 63 on a monthly time frame which suggests prices are trading near to overbought region.
Bitcoin prices’ long-term resistances are at USD 15,073 and USD 17,000 level on the upper side, and immediate support of the asset is around USD 11,792 and USD 10,655 levels.
Interesting Read: Bitcoin for Beginners: 5 things you need to know
Bitcoin surges after upward sloping channel breakout.
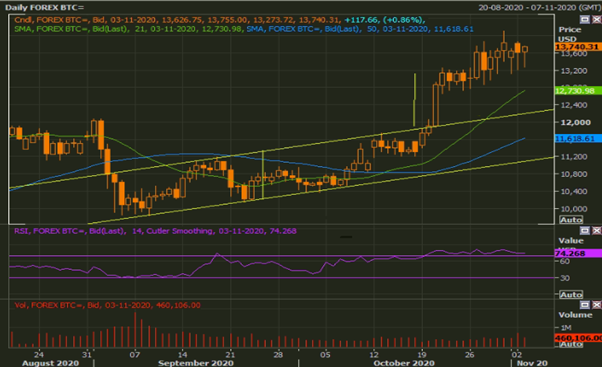
Chart Source: Thomson Reuters EODHD/Others
Bitcoin prices broke the upward sloping channel on a shorter time frame on 20th October 2020. Prices gave two consecutive closes above USD 12,065 level which was a strong resistance level on the daily chart.
Post giving two successive close above the resistance level of USD 12,065, the cryptocurrency broke the upper channel trajectory, which further took the prices up to its next resistance level at USD 13,000 – USD 13,500.
However, now, the traders might closely watch USD 12,750 and USD 11,618 marks, which lie on 21-period and 50-period moving averages, respectively.
Meanwhile, prices are not getting volume support at this juncture, which further signifies lack of strength in the current upward rally.
RSI is hovering at 74 which suggests prices are trading at overbought region and Usually such levels call for caution.
Also Read: What advice to follow before purchasing bitcoin and other cryptocurrencies?
Bitcoin Correlation with S&P 500 Index A Surprise Package?
Data Source: EODHD/Others, Thomson Reuters, Chart Source: Kalkine Group.
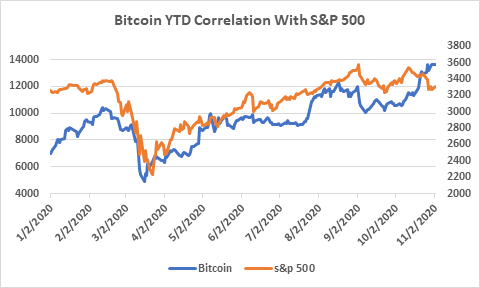
Bitcoin is witnessing high positive correlation with the leading U.S. stock index - S&P 500 on a YTD basis. Both price series are showing strong positive correlation of 0.81.
Correlation represents the relationship between two prices series. Positive correlation occurs when one price series moves in tandem with another price series.
It looks like the cryptocurrency has now become more sensitive towards monetary policy. Bitcoin is best described as digital gold. It has been long proclaimed that Bitcoin acts as a safe haven against the stock market downturns during the time of crisis. Currently, a comparison of bitcoin with gold looks premature after looking at the returns delivered by gold post the COVID-19 period as the safe haven reached an all-time high compared to the moderate price appreciation provided by the digital asset.
Meanwhile, Bitcoin and the index prices are parting their ways recently.
Must Read: Bitcoin vs Gold: Can the cryptocurrency replace the oldest safe haven?
Bitcoin Price Seasonality: Opportunity Months For Bears Ahead?
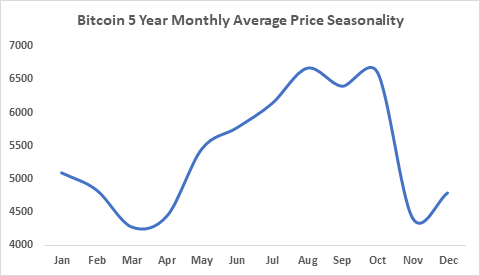
Data Source: EODHD/Others, Thomson Reuters, Chart Source: Kalkine Group.
The five years monthly average price for Bitcoin depicts that prices made its peak in August 2020 and start moving southwards from mid- September till November 2020.
Historical price data from 2018 and 2019 shows that Bitcoin prices follow seasonality where prices either fall or consolidate between August to November.
Good Read: 10 reasons why Bitcoin might not be the best investment
