
 AUS
AUS
 NZ
NZ
 UK
UK
 CA
CA
 USA
USA
 IND
IND








Source: Wit Olszewski, Shutterstock
Summary
- Ethereum has broken the major support zone on the daily chart and delivered an impressive return of ~273 percent in the last three months.
- Now the Ethereum prices are trading near major hurdle around the 21-Period SMA and Parabolic SAR indicator.
- Litecoin prices are trading near the crucial upward sloping trend line support on the daily chart.
- Ripple’s XRP price is under pressure after making an all-time high and the prices are approaching towards the support zone.
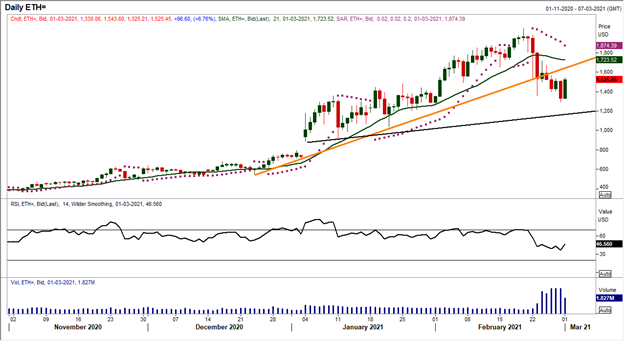
Ethereum witnessed a robust rally from the low of USD 549.25 made on December 2020 to a new lifetime high of USD 2,047.80 on 20 February 2021, a gain of ~273 percent in this short span. It has broken out of its upward trend line at USD 1,610.50 level on the daily chart and made a new lifetime high. Thereafter, the price has made a low of USD 1,293.20 on 28 February 2021, due to profit booking from higher levels, a decline of ~37 percent in 8 trading sessions.
Ethereum Daily Technical Chart
Source: EODHD/Others, Thomson Reuters; Analysis: Kalkine Group
Ethereum prices are falling with a surge in volume , that clearly indicates higher participation by traders during the bearish down trend. Currently, the price is trading below the 21-period simple moving average (SMA), which indicates that the bears have the upper hand in the short run. The immediate upside resistance is at the USD 1,690.80 level and in the short term, if the prices sustain below the breakout level, then bears might be dominant and are expected to remain active till the next support level of USD 1,200.40. Ethereum price is well placed below its Parabolic SAR and appears supportive for the downtrend. Furthermore, the momentum oscillator RSI (14-period) is trading at ~46 levels, which further supports a bearish bias for the price.
Litecoin Daily Technical Chart
Source: EODHD/Others, Thomson Reuters; Analysis: Kalkine Group
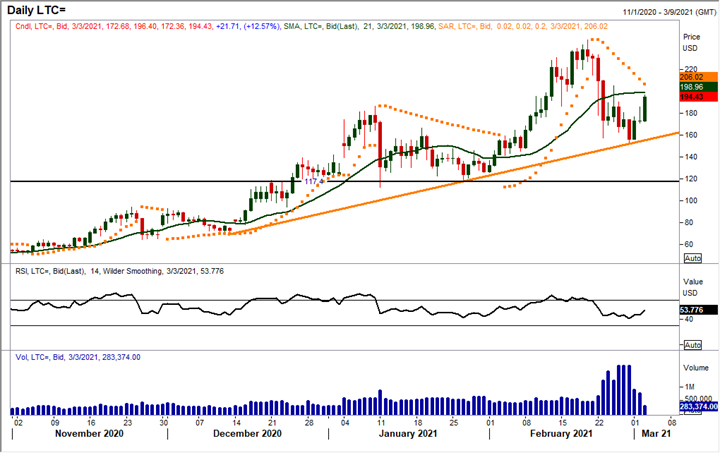
Litecoin price has been in a strong rally for the past few months and recently hit an all-time high of USD 246.99 on 20 February 2021. As per the analysis of the current chart structure, prices have been under pressure from the all-time high level and made a recent low of USD 153.95 on 28 February 2021. Now the price is trading near the upward sloping trend line support of USD 149.80 and if it manages to hold the support level, then the bulls might again pull the prices higher toward the 21-SMA resistance.
On the daily time frame chart, the price is trending upward, forming a series of higher tops and higher bottoms which, indicates bulls are still in action. If Litecoin price fails to hold the key support level of USD 149.80, then it might tumble towards the horizontal trend line support level. The momentum oscillator RSI (14-period) is trading at ~46 levels, which supports a bearish stance for the cryptocurrency. Price is well placed below its Parabolic SAR indicator, putting pressure on the prices. Furthermore, the prices are trading below the 21-SMA, acting as a crucial resistance zone.
Ripple’s XRP Daily Technical Chart
Source: EODHD/Others, Thomson Reuters; Analysis: Kalkine Group
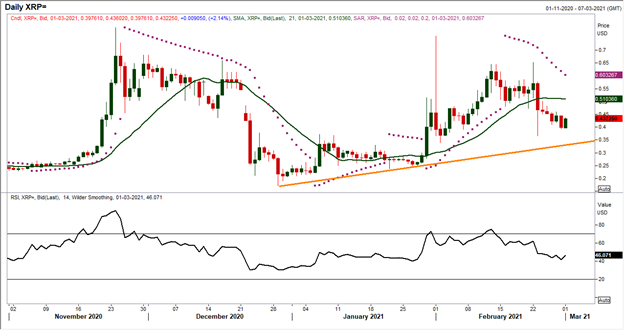
Ripple’s XRP price has been in a strong rally for the past few months and recently hit an all-time high of USD 0.75358 level. On the daily time frame chart, the price is trending downward, forming a series of lower tops and lower bottoms, which indicates bears are in action.
Now the cryptocurrency is approaching towards the rising trend line, support near USD 0.335 level. If the price fails to hold the support level, then prices might tumble towards USD 0.245 levels. At present, the price is trading below the 21-period SMA, suggesting a bearish momentum . Moreover, momentum oscillator RSI (14-period) is sustaining below 50 levels indicating that the bears may further retain the control till the USD 0.3350 level. The price is well placed below its Parabolic SAR, which supports bearish bias for the Ripple’s XRP.
Conclusion:
Based on the above chart analysis and going by the classical technical analysis theory, Ethereum seems to be in control of bears. Litecoin and Ripple’s XRP, both are holding the key support zone and the chart pattern suggests that there might be some action in Litecoin if the price remains above the support zone or breaks the crucial resistance zone in the coming trading sessions.
