
.jpg)


Summary
- Bitcoin price has dropped by ~30.66 percent from its lifetime high.
- on the daily chart Bitcoin prices are trading in a rising channel formation and below its 100-Period Simple Moving Average (SMA).
- The price has broken a rising trendline crucial support.
- The Momentum indicator MACD has shown a negative crossover.
Bitcoin witnessed a steep bull rally from the low of USD 43021 made on 28 February 2021 to a new lifetime high of USD 64899.97 tested on 14 April 2021, a gain of ~50.86 percent in just 3 months. Currently, prices have been under pressure from the all-time high and formed a low of USD 45,000 on 13 May 2021, a decline of ~30.66 percent due to massive sell-off from the higher levels.
Despite this heavy correction, Bitcoin is trading in an upward trajectory, forming a series of higher tops and higher bottoms, which indicates bulls are holding ground. During Thursday’s trading session, the cryptocurrency price fell below the USD 50,000 mark after Tesla CEO Elon Musk tweeted that the electric car maker would stop accepting Bitcoin as payment for its vehicles.
Watch: The Buzzing Trends || Why Did Tesla Inc. Cease To Accept Bitcoin As A Mode Of Payment?
Bitcoin on the Daily Chart
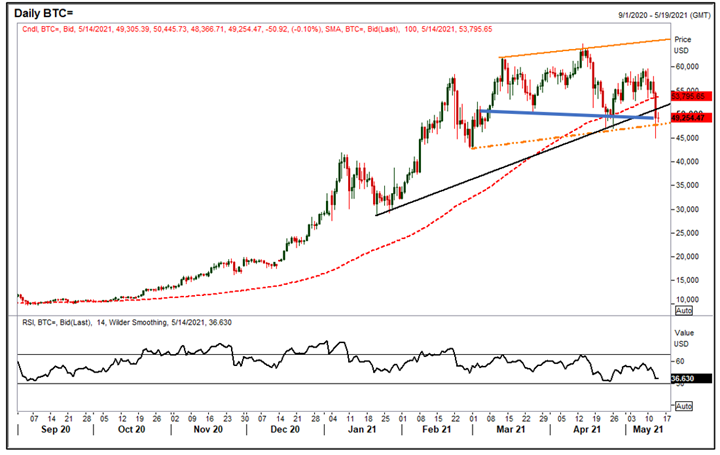
Source: EODHD/Others, Thomson Reuters; Analysis: Kalkine Group
The prices are trading in a rising channel pattern for the last three months and currently, hovering around the lower band of the pattern. The price has broken down of its rising channel pattern at USD 48,160 level but managed to sustain at the lower level. Prices also broke an upward sloping trend line (black color trend line in the above chart) at USD 51,750 level on the daily chart, and now trading below the rising trendline support level. If prices continued to trade below trend line resistance, then there might be a change in the trend from upward to downward.
Interestingly, the prices closed below its 100-period SMA for the first time in the last 9 months and now acting as a crucial hurdle for the cryptocurrency. The momentum oscillator RSI (14-period) is trading at ~36.63 levels, indicating that an upside movement after the extension of the current pullback may take prices higher towards the resistance zone. The bears would be closely watching the formation of head and shoulders pattern, whose neckline is marked in blue on the daily chart above. Prices holding above the neckline would bode well for the bulls.
Bitcoin on the Weekly Chart
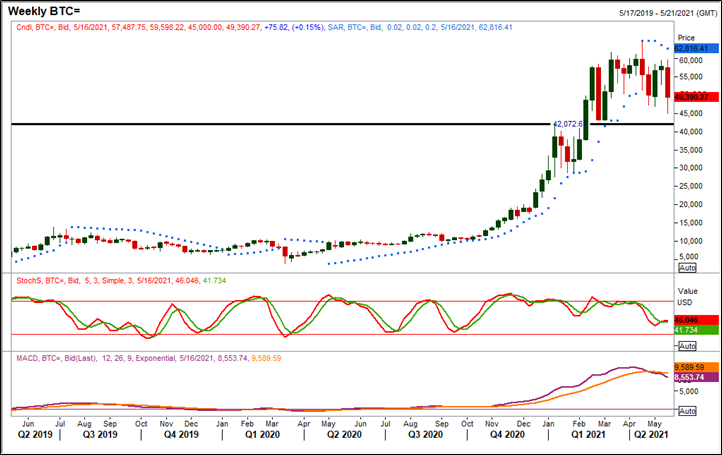
Source: EODHD/Others, Thomson Reuters; Analysis: Kalkine Group
On the weekly chart, the price has broken the horizontal trendline resistance at USD 42,072.60 level on 08 February 2021 and sustaining above the breakout level. After the breakout, Bitcoin has rallied almost USD 22,827 points and touched an all-time high. However, MACD (Moving Average Convergence Divergence) is showing a negative crossover, indicating the possibility of a downside correction. The prices are trading below the Parabolic SAR indicator, acting as a crucial resistance zone for the medium term. Moreover, the momentum oscillator Stochastic slow is trading below 50 levels, also indicating a negative trend for the prices.
Based on the above chart analysis and technical indicators outlook, Bitcoin seems to be in a primary uptrend; however, looking at the current scenario prices seem to be under pressure from higher levels. Presently, the prices are holding the key support zone. The chart pattern suggests that there might be more action expected if the cryptocurrency breaks the crucial support levels or edges higher towards the next resistance level in the coming weeks.
