
.jpg)


Silver spot prices are consolidating after correcting from the recent peak of USD 29.863 per ounce (intraday high on 7 August 2020). The current range for the spot is between USD 24.800 to USD 24.100, and the range seems to be shrinking as compared to the previous ranges, suggesting that the volatility in the precious white metal is declining.
However, as the volatility is diminishing, sentimental data such as CFTC speculative net longs, put-call ratio, are pointing towards bullish sentiment in the market, which might help the bulls to remain buoyant.
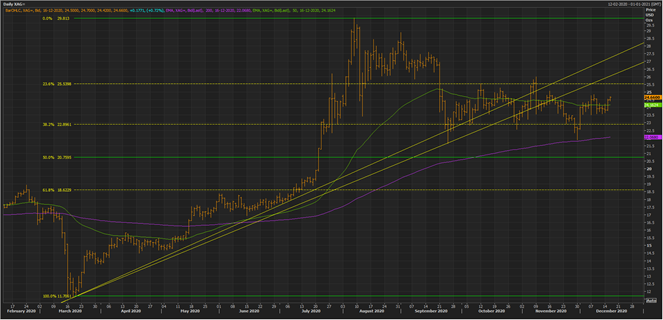
Silver Spot Daily Chart (Source: EODHD/Others Eikon Thomson Reuters)
On the daily chart, it could be seen that silver prices breached the support zone around the medium-term trendlines to complete 38.2 per cent retracement of the previous rally, which started from the level of ~ USD 11.706 and petered down around USD 29.813 per ounce level.
Currently, the spot is trading below the 50-day exponential moving average (EMA) but is above the 200-day EMA, suggesting that the trade is now under a low intensity tug-of-war between bulls and bears: inferred from the low volatility.
The primary and immediate support for the spot price is at the 200-day EMA while the primary resistance is around the previous support zone.
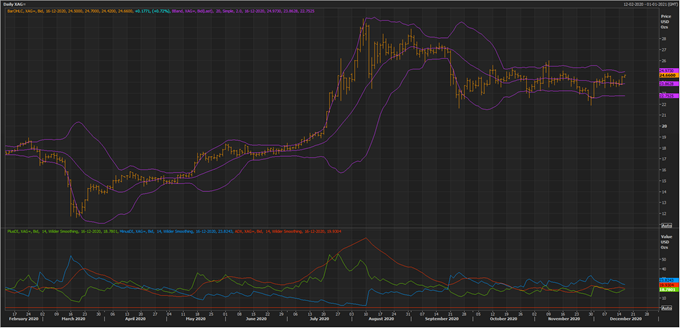
Silver Spot Daily Chart (Source: EODHD/Others Eikon Thomson Reuters)
On the daily chart it could be seen that the 20-day simple Bollinger Band® is now shrinking, suggesting that the volatility is declining. The spot is currently in a range-bound trade between the +2 Standard Deviation and -2 Standard Deviation of the Bollinger Band with the majority of sessions concluding near the middle line (20-day SMA).
However, with a decline in volatility, the directional indicators are showing a slight negative behaviour with the +DI sloping downwards while the -DI sloping upwards, suggesting that the majority of the volatility in the 14-day period ATR (average true range) is towards the downside.
Furthermore, the 14-day ADX is slightly sloping up, reflecting that the silver spot might soon see some action, which at present, is slow and in a range.
While the price action seems to be giving slight negative indications, the sentimental data around the silver spot is projecting opposite with the CFTC net speculative longs surging on a weekly basis.
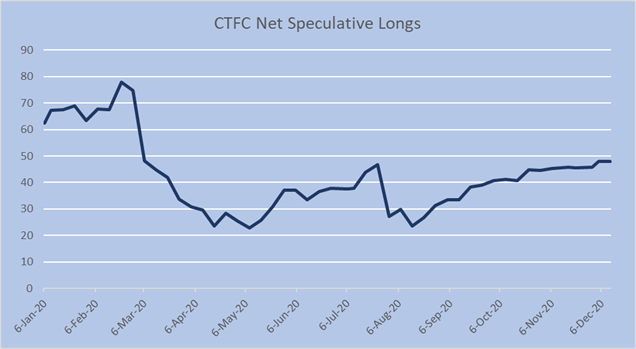
CFTC Speculative Net Longs (Data Source: CFTC)
Since the onset of the September 2020 quarter, the CFTC net speculative longs or non-commercialised longs are increasing while the price was in a consolidation, reflecting that speculators are building long positions.
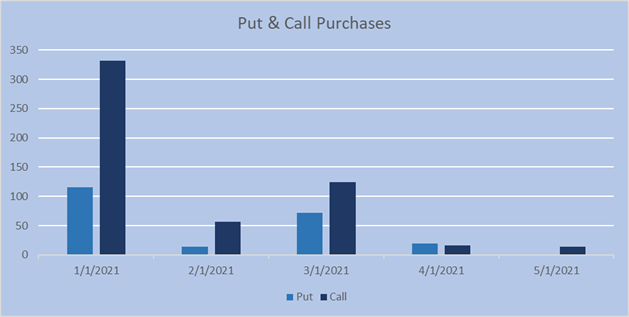
Monthly Put & Call Purchases (Future Expiry) (Data Source: EODHD/Others Eikon Thomson Reuters)
Apart from a net increase in speculative long, the number of purchases on the call option for future expiry (especially January 2020) is relatively higher against the put option, leading to a downward slope in the put-to-call ratio, which in tandem with a net increase in speculative longs, suggest bullish sentiments are prevailing around the silver spot price.
