


Gold has been under a crabwalk for a while with economic situations around the globe taking a turnaround with the rollout of COVID-19 vaccine. The spot market has been stuck in a range for quite a while; however, after a period of slow moves, gold has picked up some pace over certain geopolitical developments on the global front.
The spot is once again under an upsurge with prices increasing from USD 1,789.99 per ounce (intraday low on 30 November 2020) to the recent high of USD 1,959.60 (intraday high on 6 January 2020), marking a price appreciation of ~ 9.47 per cent.
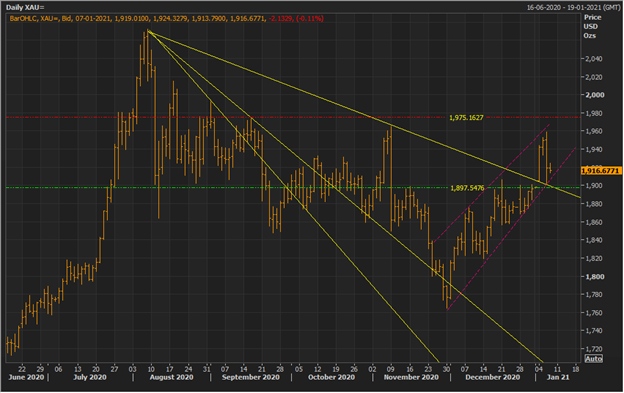
Gold Spot Daily Chart (Source: EODHD/Others Eikon Thomson Reuters)
On following the daily chart, it could be seen that the spot market has been trading in an upward sloping channels with successive higher lows and higher highs, suggesting that bulls are in play. In the recent past, gold had breached its primary resistance at USD 1,897.54, which could act as the primary support for the price now.
Also, the upper range of the upward sloping channel is overlapping with the major resistance at USD 1,975.16, making it somewhat confirmatory in nature. A break and price action above the same with some degree of confirmation might seed bullish sentiments ahead.
Over the long-term, it could be seen that the spot market has breached its support zone with prices now even trading above the final downward sloping trendline, which is overlapping with the bottom line of the channel.
A break and price sustenance below the same could dent bulls and might seed bearish sentiments.
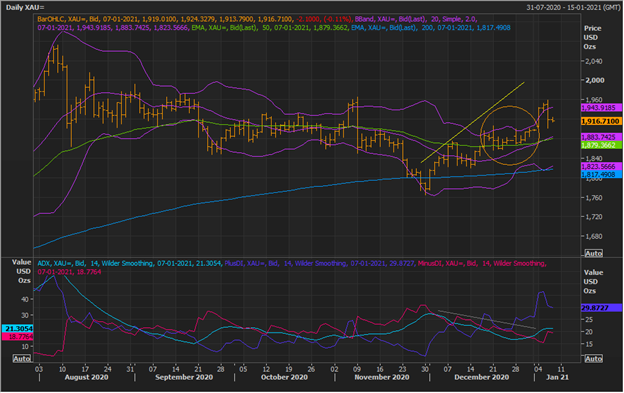
Gold Spot Daily Chart (Source: EODHD/Others Eikon Thomson Reuters)
On further following the daily chart, it could be seen that the spot attempted a volatility breakout with prices crossing the +2 Standard Deviation of the 20-day simple Bollinger Band®. However, failed to sustain the same, leading to a slight consolidation on 7 January 2020 (till 4:48 PM AEDT).
Once again, the 20-day SMA and 50-day EMA are overlapping around the same zone as compared to the support zone suggested by overlapping of the downward sloping trendline and the bottom line of the short-term channel; thus, making it a strong support zone, and perhaps a decisive level as well.
While a majority of volatility over the past 14-day has been towards the upside, and the plus DI being above minus DI, the ADX is sloping downwards, reflecting that the recent rush might not be a strong trend. The indication from ADX divergence calls for caution in the market.
Also, the recent trading sessions of many outside bar and inside bar followed by a bar crossing the high of the inside bar (the circle on the above chart) along with some divergence in ADX might be an indication of some profit booking in gold around the present level.
