


Highlights
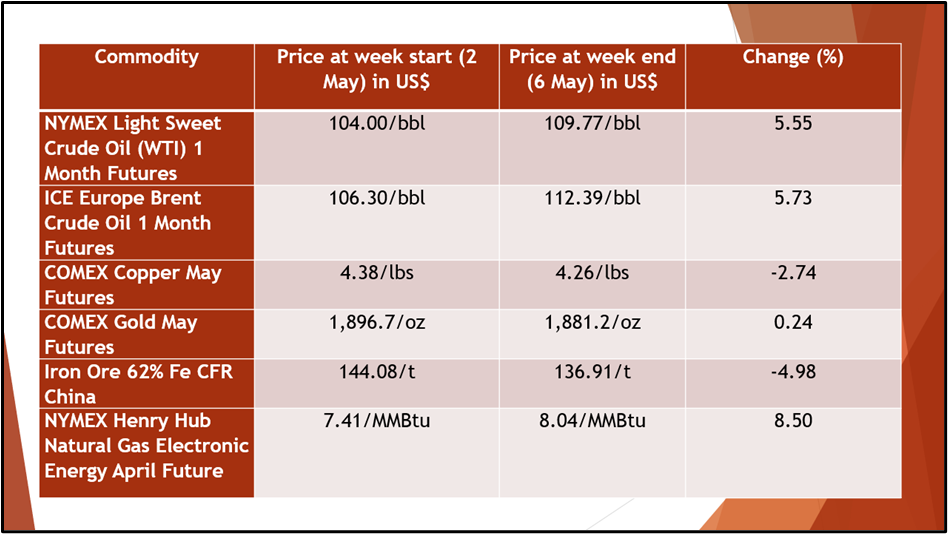
- Prices of both crude oil benchmarks have gained in the last week by more than 5.55%.
- The bullion has jumped 0.24% while silver has dropped significantly in the last week.
- Prices of base metals, including copper, aluminium and iron ore also have shed in the last week due to lower demand in China.
Commodities ended the last week on a mixed note. China's latest COVID-19 outbreak further spooked investors, who were already worried about quicker US interest rate hikes possibly denting economic growth. Additionally, the ongoing economic slump in China and the prolonging Russia-Ukraine tussle have also affected commodity markets.
In the energy domain, prices of both crude oil benchmarks, WTI and Brent, gained more than 5.55% last week. WTI crude oil futures hovered near US$109.77/bbl on Friday while Brent crude oil futures traded near US$109.77/bbl. Natural gas prices have also gained 8.5% in the last week due to higher demand and rising concerns related to future supplies.
Also Read: Crude oil surges to 14-year highs on delays in Iranian talks
Image source: © 2022 Kalkine Media®
In addition to this, uranium prices have gained in the last week nearly 1.8%. The prices have rebounded from seven-week lows of US$53/lb in the last week of April amid higher uncertainty in the energy market as EU nations discussed the extent of restrictions on the Russian energy supply.
Must Watch: As Russia-Ukraine War Intensifies, Commodities Also Soars
Among precious metals, gold has logged a marginal gain in its prices in the last week. The bullion jumped 0.24% while silver dropped significantly to reach the levels last seen in January as impending interest rate hikes from the Federal Reserve sparked a rally in the US dollar.
Prices of base metals, including copper, aluminium, and iron ore have toppled in the last week due to lower demand from China as the country logged rising COVID-19 cases. Furthermore, prices of battery metal lithium remained stable during the period while nickel has tumbled significantly in the last week.
Australian Energy Index at multi-year resistance level
On converging at the Australian energy market, the S&P/ASX 200 Energy Index (XEJ) gained marginally 0.53% today to trade at 10,170.20. Looking at the multi-year chart, it seems like the Energy index stands at its multi-year resistance level.
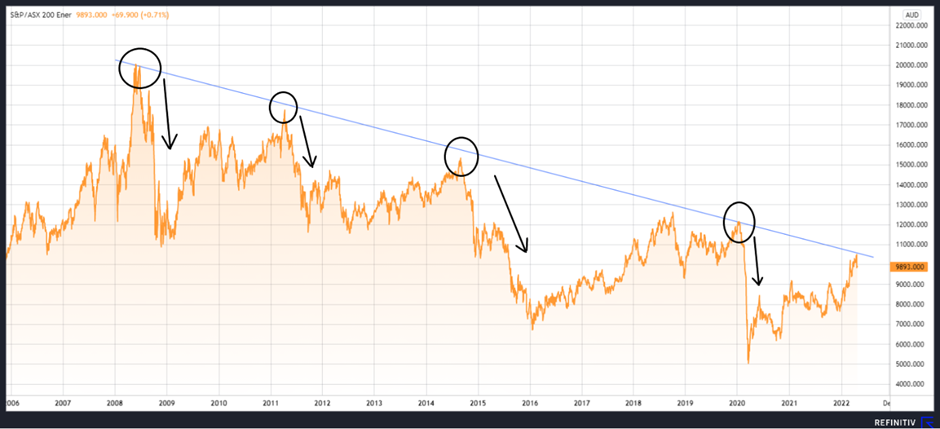
S&P/ASX 200 Energy Index (XEJ) chart | Source: EODHD/Others Eikon
Additionally, the index has made significant corrections every time it reached the demarcated resistance level.
Must Read: Which are the best performing commodities of 2022?
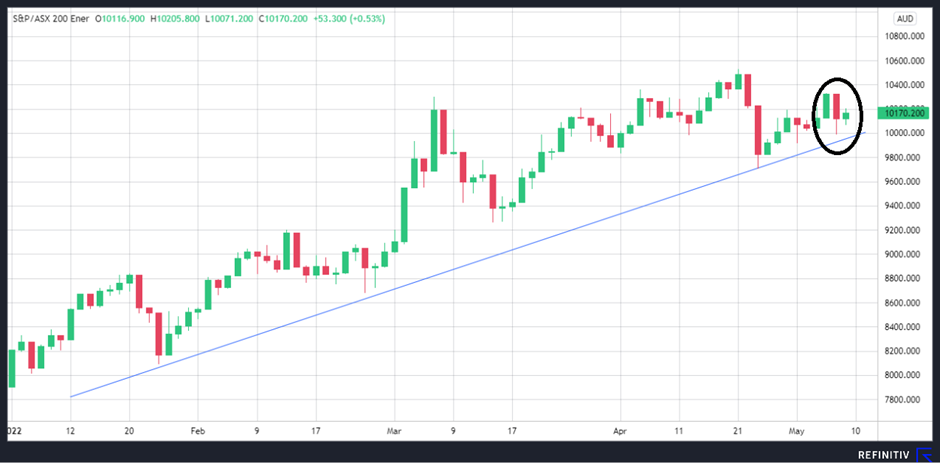
S&P/ASX 200 Energy Index (XEJ) candlestick chart | Source: EODHD/Others Eikon
On casting a glance at the short-term YTD chart, it looks like the index is trading at an inflection point with a red candlestick. Market participants would be closely tracking the price action which is considered important by many technical analysts.
Against this backdrop, let's skim through a few commodities that were popular among traders in the past week.
Data Source: Eikon EODHD/Others
Here are a few significant commodities that have recorded substantial volatility in the last week.
Natural Gas
Natural gas has rallied to new 14-year highs of US$8.98/MMBtu in the last week. The prices have been increasing since April end as investors remained concerned about supply. At the same time, export facilities have been running at ramped-up levels to supply LNG to Europe.
Crude oil

Source: © Batareykin | Megapixl.com
Prices of both crude oil benchmarks gained significantly on fears that the Russian supply would continue to be disrupted by the conflict in Ukraine. Crude oil futures have risen in the last week, the impending EU embargo on Russian oil outweighed concerns about global economic growth.
Here’s how commodities performed in the last week click here