


Source: Olivier Le Moal, Shutterstock
Summary
- Gold gave its first quarterly negative returns since September 2018.
- The rising bond yields & strengthening of the US dollar acting as a primary catalyst for the decline in precious metals prices.
- Gold and Silver prices are holding grounds as they are trading above 21-period simple moving average on a monthly time frame chart.
- Silver is taking crucial support of the downward trendline that might provide upside potential as per expectation.
Gold’s strong hold as a safe haven is challenged by Bitcoin, however, only time will tell if the status can change among the masses. Gold prices are giving negative returns and drifting downwards for the past several months amid overall good performance of global equity indices, stronger US dollar position, and the COVID-19 vaccine rollout. The US dollar index prices are inversely correlated to gold and silver prices. Additionally, rising US bond yields is also not supporting the gold prices. However, rising inflation may create pressure on the equity indices that could help gold to outperform other asset classes in the future.
Must Read: Gold slides as bond yield & US dollar strengthens, is this an opportunity?
Gold: Past Price Action Summary
Gold prices have witnessed tepid movement in the past couple of months, but the yellow metal is still trading in a primary upward trend. After the gold made an all-time high level of $2,063 in August 2021, prices seem to have made an ABC corrective pattern on a monthly chart and hit a low of $1,673.70 that is ~19% downside correction from higher levels.
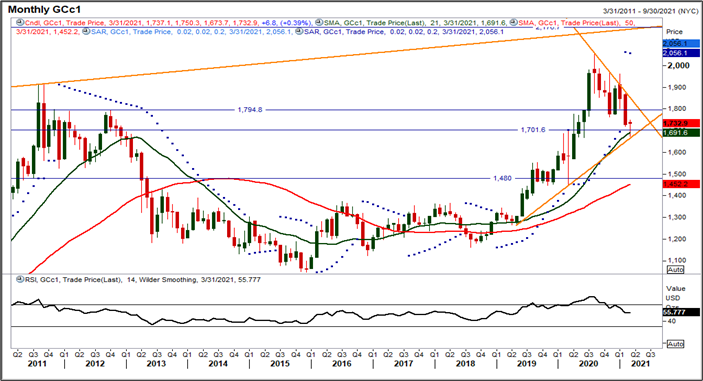
COMEX Gold Composite Commodity Future Continuation 1 (GCc1) Monthly Chart (Source: EODHD/Others, Thomson Reuters)
As per the chart analysis, the gold price seems to have trapped in a continuously narrowing symmetrical triangle pattern and might consolidate in a range between $1,701-1,794 per troy ounce. However, any breakout above or below the mentioned levels will decide the future direction of the commodity.
The momentum indicator RSI (14-period) is trading near around ~55 levels which is still supportive for the upward momentum. Gold prices are holding grounds above the trend-following indicator 21-period SMA which also appears a good sign for bulls. Key immediate supporting levels appear to be at $1,701, a break of the same might create further stress on the price till its next support level, near the 50-period SMA.
Gold Price Seasonality:
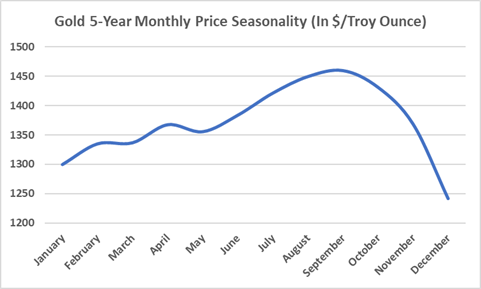
Chart Source: Kalkine Group, Data Source: EODHD/Others Eikon, Thomson Reuters
Spot Gold's 5-year monthly price seasonality clearly shows that the prices started declining from September onwards till December. Gold prices might again and find an upside push from April onwards if it follows the above price seasonality. It can be analysed from the above chart that gold spot prices are following the 5-year monthly price seasonality pattern.
Gold Prices are likely to consolidate at current levels. However, rising cases of the COVID-19 globally and recent news of lockdowns in various countries might give some upside push to the yellow metal. As the bitcoin prices are trading at the extremely overbought zone, investor’s first choice would be the traditional safe-haven commodity i.e., gold above other asset classes such as equities.
Also Read: Gold vs Bitcoin: Can bitcoin be the next " Safe haven" ?Are Silver Prices Losing the Shine or Just Taking a Breather?
Silver prices took the attention of investors in the last one year as prices rallied more than 100%. Prices broke the downward trendline resistance in December 2020 and made a high of $28 in February 2021.
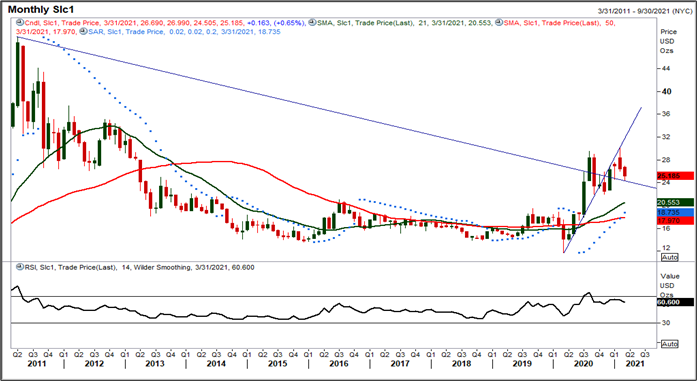
COMEX Silver Composite Commodity Future Continuation 1 (SIc1) Monthly Chart (Source: EODHD/Others, Thomson Reuters)
Silver prices are facing resistance around the rising trendline and took the support of a long-term downward trendline. Prices are backed by a golden positive crossover between the 21-period SMA and 50-period SMA, indicating an upside trend on the monthly chart. Prices are also trading above the Parabolic SAR indicator and appear supportive for the upward momentum. Besides, the momentum oscillator RSI (14-period) is trading at ~60 levels, indicating that the prices are trading in a bullish trajectory.
Prices are now trading near to a crucial support level of $24.50, a break below that might further create pressure on the prices. On the higher side, the $29.53 level is crucial as itis acting as an important resistance level.
Gold and Silver prices are trading at their key support levels. However, considering the price action and analyzing the charts, both are still trading in a primary bullish trend. Market participants need to keep a close watch at the breakout of the key levels to decipher the next moves.
