


Source: Eviart, Shutterstock
Summary
- Sunpower Corp. prices are trading above the crucial upward sloping trendline support on the weekly chart.
- Sunpower Corp. prices hold the 61.8% Fibonacci retracement level and delivered multifold returns in the last four months.
- Renewable Energy Group Inc. trading around the key horizontal trend line and 21-period SMA support.
- Ormat Technologies Inc.’s price has formed a bullish engulfing candlestick pattern (bullish reversal) and prices are trading above the upper band support of the rectangle channel pattern.
Sunpower Corp. (NASDAQ:SPWR) has risen almost 4 fold from its low of USD 14.66 in October 2020, to a new all-time high of USD 57.51 levels on 29 January 2021. The stock prices have been under pressure post hitting an all-time high . It made a recent low of USD 27.38 level on 05 March 2021. After this massive sell-off, now the stock is consolidating at a lower level on the weekly chart.
Sunpower Corp. on the weekly chart
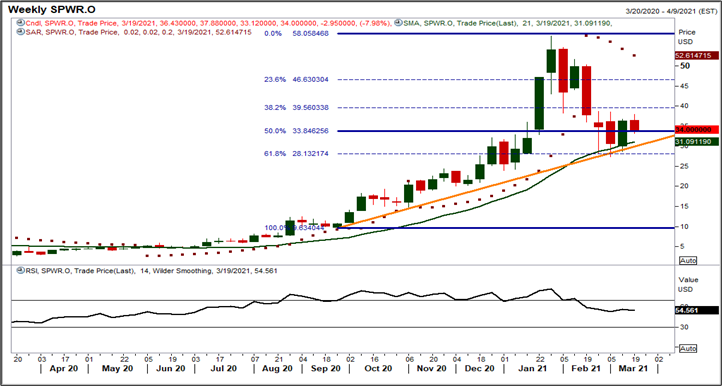
Source: EODHD/Others, Thomson Reuters; Analysis: Kalkine Group
The stock has taken the support of its 61.8% Fibonacci retracement level at USD 27.38 of the previous rally (from USD 9.54 to USD 57.51). Currently, the price is hovering near its rising trendline support zone and if the stock price sustains above the major support level of USD 27.38 then bulls might dominate the trade and might remain active till the next resistance level of USD 54.22.
Besides, the stock price is trading above its 21-period SMA, which is acting as a crucial support zone near an upward sloping trendline. The price is trading below the Parabolic SAR indicator, acting as a crucial resistance zone at USD 54.22 level. The momentum oscillator RSI (14-period) is trading at ~54.56 levels.
Renewable Energy Group Inc. on a weekly chart
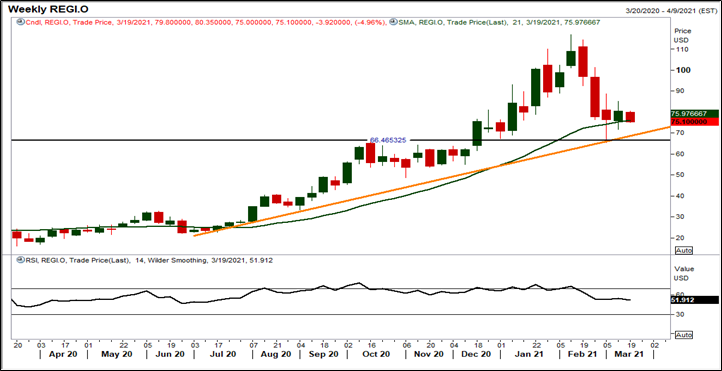
Source: EODHD/Others, Thomson Reuters; Analysis: Kalkine Group
The Renewable Energy Group Inc. (NASDAQ:REGI) witnessed an uninterrupted rally from the low of USD 48.63 made on 04 November 2020 to a new all-time high of USD 117 (on 10 February 2021), a gain of ~157 percent in this short span. Currently, prices have been under pressure and formed a low of USD 65.41 level on 05 March 2021 a drop of almost 44 percent.
The prices are trading above the upward sloping trendline support level of USD 68.70 and continuously taking support from the trendline. The price is also hovering near its horizontal trendline support zone at USD 65.84 level on the weekly chart. Any upside movement from the current levels might be dominated by the bulls and expected to remain active till the resistance level of USD 100.50.
Currently, the stock is trading around the 21-period SMA, which is acting as a crucial support zone for the stock on the weekly chart. The major support level for the stock is at the USD 66.25 level and any price action with some degree of confirmation below this level might attract bearish sentiments ahead. Moreover, the momentum oscillator RSI (14-period) is trading at ~51.92 levels.
Ormat Technologies Inc. on a weekly chart
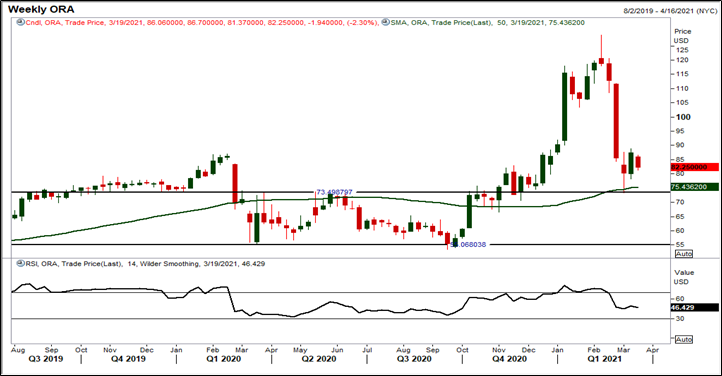
Source: EODHD/Others, Thomson Reuters; Analysis: Kalkine Group
The Ormat Technologies Inc. (NYSE:ORA) has broken out of its rectangle channel pattern at USD 73.72 level and after that the price made an all-time high of USD 128.87 on 10 February 2021. Post that, the price has made a low of USD 73.35 on 05 March 2021, due to a massive 43 percent sell-off.
Currently, the stock is taking the support of the upper band of the rectangle channel and if it manages to hold the immediate support of USD 73.30, then the prices might trade higher. Any price action below the support level of USD 73.30 with some degree of confirmation, might been seen as a negative sentiment.
A bullish engulfing candlestick pattern (bullish reversal) is formed on the weekly chart. Besides, the stock price is trading above its 50-period SMA, acting as a crucial support zone at the upper end of the pattern. The momentum oscillator RSI (14-period) is trading at ~46.43 levels, which may attract bulls over the short-term, extending the rally towards the level of USD 103.20.
