
 AUS
AUS
 NZ
NZ
 UK
UK
 CA
CA
 USA
USA
 IND
IND


.jpg)





Trading shares or applying technical analysis is a mixture of both science and art. It is science in terms understanding the various nuances of chart patterns, back-testing, trading system, etc. It is an art when it comes to understanding market psychology and building a trading intuition.
Image source: Megapixl
In order to achieve both, understanding of the basic trading principles and some experience which eventually comes with time is important. The year 2020 is coming to an end, and it was extremely volatile. A novice trader would have booked major losses during the March market collapse. Having good trading knowledge is paramount. Let us have a look at some of the fundamental aspects of trading to help the reader trade efficiently in 2021.
The first and foremost principle of trading is some basic understanding of technical analysis, which includes understanding trends, breakouts of some chart patterns, and implication and mathematics of technical indicators.
Understanding the Trend
Image source: Megapixl
The trend in laymen’s language could be defined as the direction of the price of an underlying financial asset. There are basically 3 types of trend.
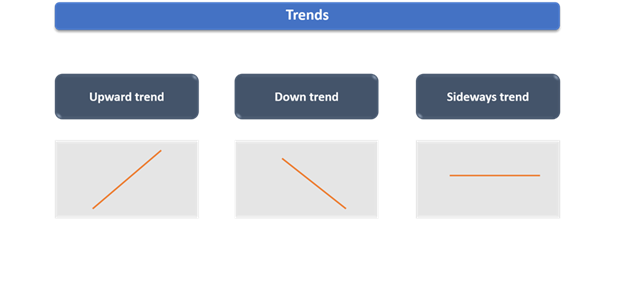
Image Source: Kalkine Group
The uptrend could be ideally be defined as a series of higher highs and higher lows in the prices of underlying security while a downtrend could be taken as an exact opposite of an uptrend.
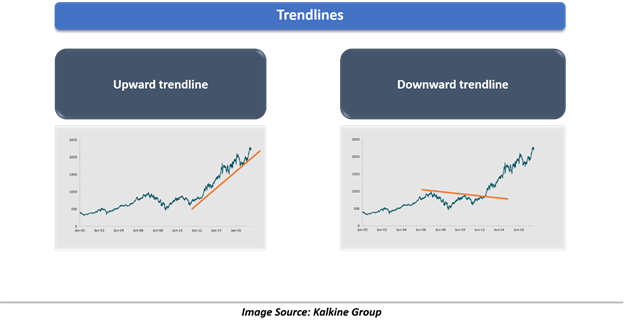
Identifying trend when it is developing in the early stages, riding it to an inevitable end, and exiting when it is reversing is a good goal to have to become a wealthy and successful trader. However, it is easier said than done, and requires a lot of understanding of market psychology and experience.
Some of the tools which are developed in assessing the direction of a trend are: moving averages, trendlines, and regression lines.
Many traders prefer to just stay with the trend and avoid any sideways price movement, which is nothing but a series of irregular highs and lows. However, some may choose to even trade in a consolidation post identifying the support and resistance level within it; and it usually depends on the risk & reward profile of an individual trader.
Understanding Chart Patterns
Once you have mastered the art of picking trend, the second target should be to understand price patterns that unfold in the market.
Typically, price patterns could be broadly categorised into continuation patterns and reversal patterns. Some of the most famous price patterns include double top/bottom, triangles, head & shoulder, wedges, flags & pennants.
Understanding the chart patterns and underlying psychology are other crucial steps to become a good trader.
Understanding Some But All Technical Indicators
Broadly speaking, technical indicators could be defined as a set of mathematical calculation that either use price, volume, or some other type of market data to provide visual indicators which could be used to gauge the market sentiment.
Novice traders usually jump straight to the technical indicators as they sound amazing and many financial newspapers and technical reports base their opinions or recommendations to buy/sell/hold based on these indicators.
However, a majority of the technical indicators using the same data inputs roughly give the same signal and understanding all of them could be tiring and unfruitful.
Thus, understanding and using a set of technical indicators that use different data inputs could widen your knowledge and understandability of the market.
Some Resources That Might Help
Books
- Charles D. Kirkpatrick II and Julie R. Dahlquist.
- The Candlestick Course - Steve Nison.
- John J Murphy – Technical Analysis of Financial Markets.
- The New Trading For a Living – Alexander Elder.
