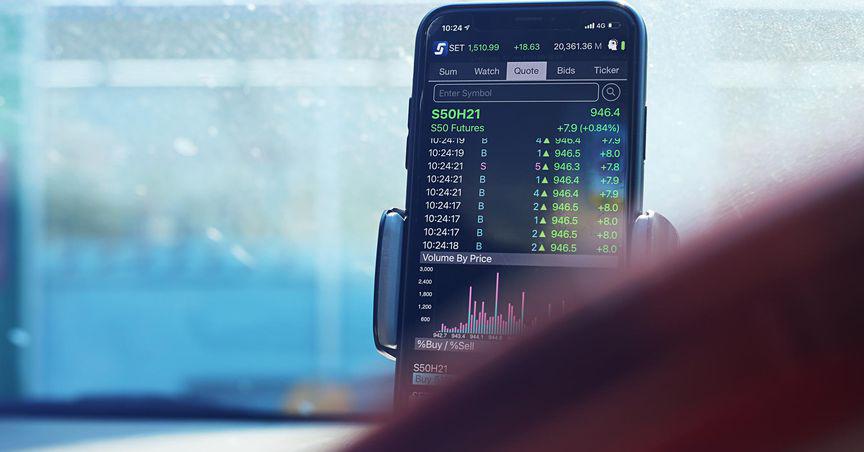
There are two ways to analyze financial markets before opening any trade. Fundamental analysis and technical analysis. While some traders choose to trade with only fundamental or only technical analysis, combining both gives a better edge in trading. When using technical analysis, there are indicators you don’t want to miss. Let’s discuss which indicators are most popular and why you should know about them.
Indicators Explained
Indicators are very popular tools for analyzing asset prices and making educated decisions. An indicator is a mathematical formula that takes market prices for a specified asset like Stock, Forex pairs, cryptos, etc. for a specified period of time, makes calculations, and shows the results. Indicators like moving averages draw results on the charts, while other indicators have a dedicated window below the price chart. These indicators are mostly oscillators that need their own window to show specific data. With indicators, it becomes much easier to analyze and see what the price is doing, whether it is trending higher or lower than the average price for some period of time, or it is in oversold and overbought zones.
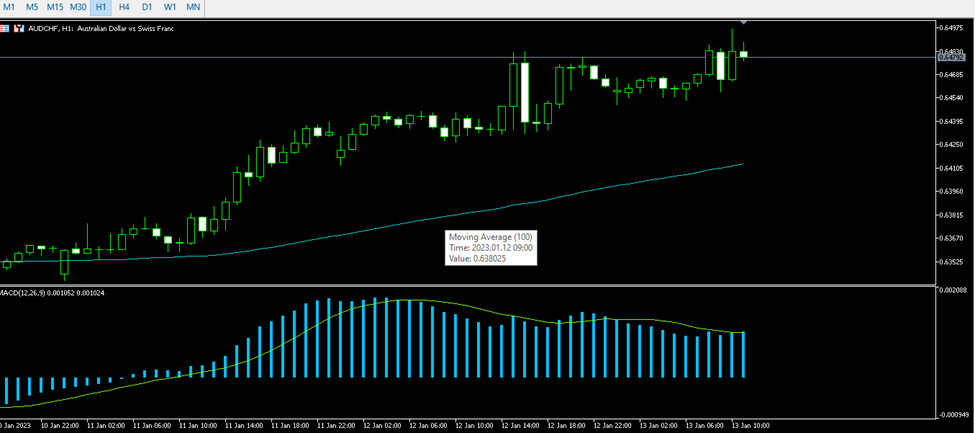
Source: MetaTrader4
There are different types of indicators
- Trend - consists of trend following indicators like moving averages, Bollinger bands, standard deviations, etc.
- Oscillators - oscillate between specified levels and show the current strength of the price direction, popular oscillators are MACD, ATR, RSI, and Stochastic.
- Volumes - try to measure the volume of the movements and derive some useful information after certain calculations, on balance volume, money flow index, and Accumulation/Distribution are the most popular ones.
- Bill Williams - now, Bill Williams is a star in the indicators space, he created many highly used and popular indicators and has a dedicated section on MetaTrader 4 and 5 platforms, most popular Bill Williams indicators are Fractals, Alligator, Awesome Oscillator to name a few.
- And custom - custom indicators are created by users and are not included in the platform. They can be downloaded online from forums, marketplaces, or developed by the traders themselves. Some traders even buy paid custom indicators.
Inbuilt vs custom indicators, main differences
The main difference between inbuilt and custom indicator is obviously their availability. Custom has to be downloaded or programmed manually, while inbuilt indicators come with the trading platforms. MetaTrader 4 and 5 have a vast amount of indicators inbuilt. Some indicators to use on the MetaTrader 5 platform are given on this website. There are pros and cons of inbuilt vs custom indicators. Inbuilt indicators are easy to use and don't require additional installations and other advanced procedures, and can be used right from the menu. While custom indicators have to be downloaded and installed, and then you have to find them in the navigator side menu in MetaTrader. While inbuilt indicators are more comfortable and easier to use, custom indicators can provide a greater value to use specified algorithms that analyze certain market conditions according to user needs. Many inbuilt indicators come with limited customization features, while custom indicators can be fully adapted to the user.
How to use indicators
It is mostly possible to run an indicator with a few easy clicks. For MetaTrader platforms, indicators are located in the upper menu.
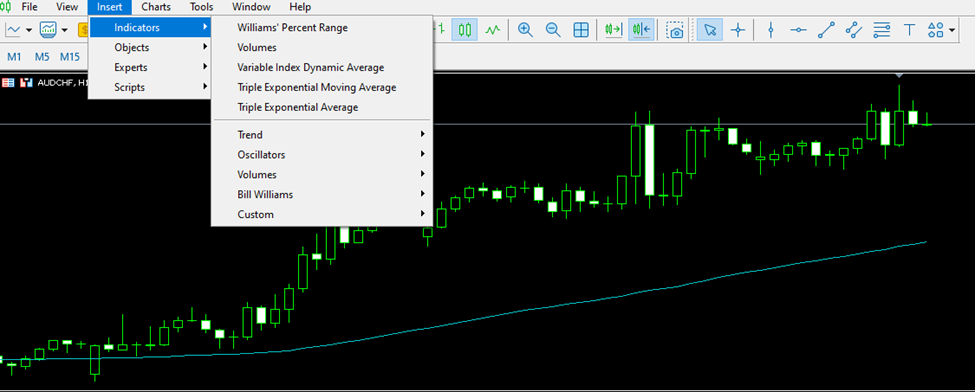
Source: MetaTrader4
After this, just select the indicator you want to use. Do not forget to specify all the parameters that you need like period and other settings. There are default settings for all indicators that are most popular for the indicator, and sometimes it is a good idea to use default parameters.
Top inbuilt indicators every trader should know
Let us describe a few widely used indicators from each type and sort them by popularity.
Moving averages
When thinking about indicators, moving averages are the first to come to mind. There is a reason why they are so popular. As simple as they are, they provide the most value to see the overall trend and how strong it is relative to the average price. Sometimes moving averages act as dynamic support and resistance levels, predicting the next reversal or continuation levels on the chart. Moving Averages or MAs are trend-following indicators that show price change for specified periods of time.
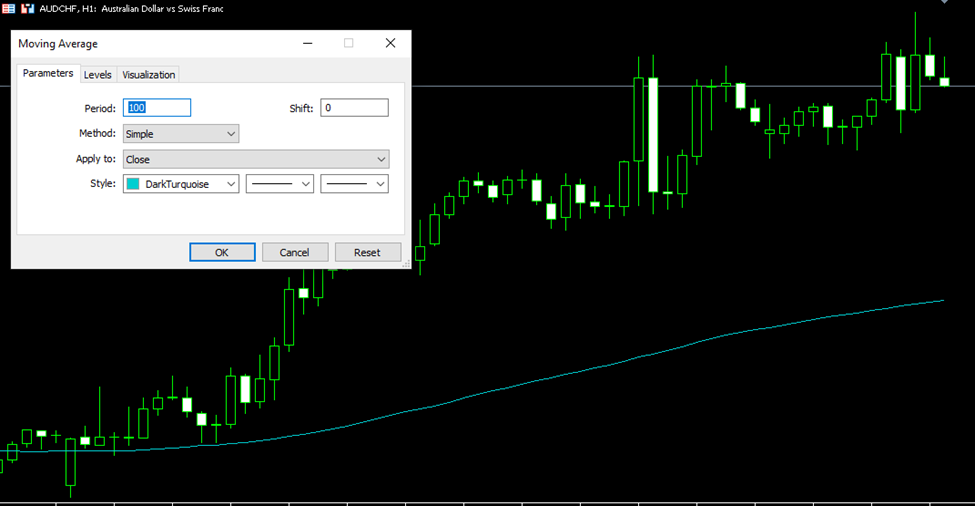
Source: MetaTrader4
Moving averages are a great basis for further analyzing the price charts. As we can see above, the price is above the average price of 100 1h candles. Prices often tend to return to MAs and when used with other indicators it becomes easier to successfully predict price movements.
MACD
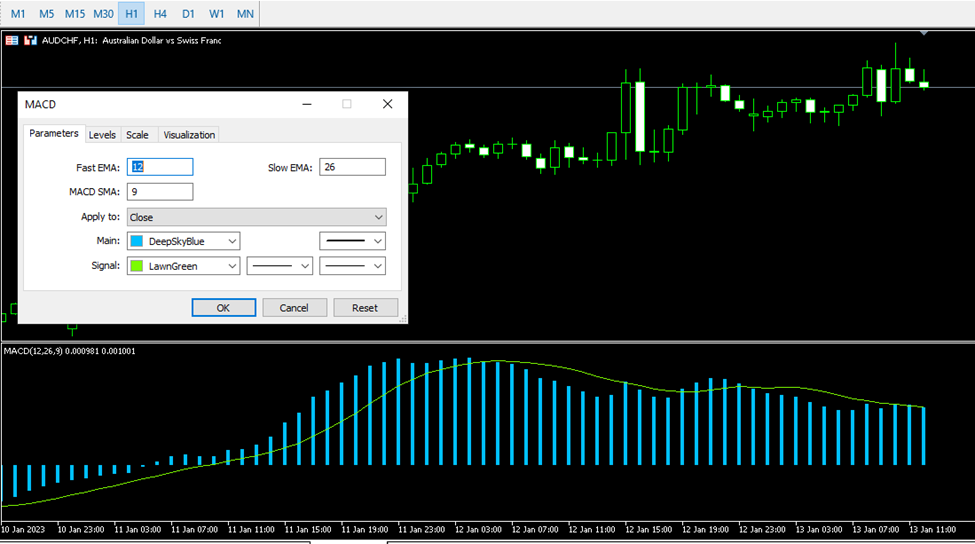
Moving average convergence divergence is another great and popular indicator. MACD is an oscillator, meaning its result is oscillating above and under zero level. In short, MACD shows the relationship between two exponential moving averages, and it is a trend-following momentum indicator. MACD can show if the price is overbought or oversold and can trigger a buy or sell signal when its signal line crosses the MACD line.
Source: MetaTrader4
Volumes
While not as useful in Forex, volume is still very important for stock and crypto trading where the volume of the asset is accessible. The volume in Forex is useless because it doesn’t show real volume and is calculated from various tick data instead. Volume can be a good indicator of how much pressure the market is experiencing and if the current trend is supported by enough power behind it.
Risk Disclosure: Trading in cryptocurrencies involves high risks including the risk of losing some, or all, of your investment amount, and may not be suitable for all investors. Prices of cryptocurrencies are extremely volatile and may be affected by external factors such as financial, regulatory, or political events. The laws that apply to crypto products (and how a particular crypto product is regulated) may change. Before deciding to trade in financial instrument or cryptocurrencies you should be fully informed of the risks and costs associated with trading in the financial markets, carefully consider your investment objectives, level of experience, and risk appetite, and seek professional advice where needed. Kalkine Media cannot and does not represent or guarantee that any of the information/data available here is accurate, reliable, current, complete, or appropriate for your needs. Kalkine Media will not accept liability for any loss or damage as a result of your trading or your reliance on the information shared on this website.

