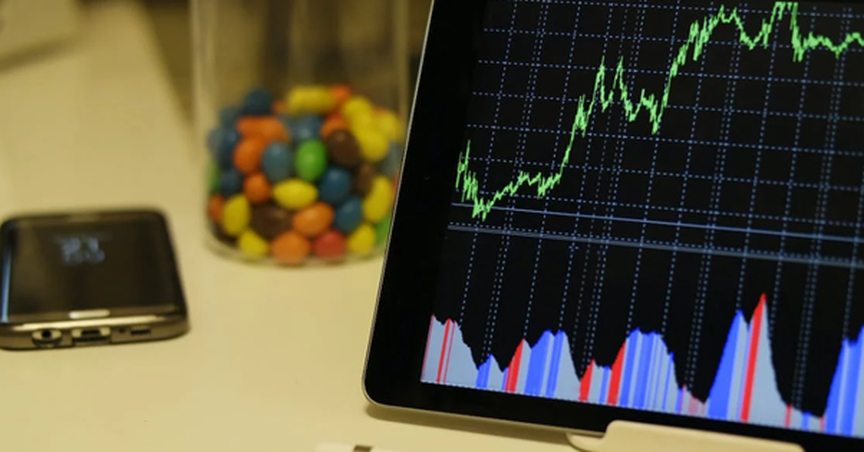
Forex chart patterns allow traders to identify market entry points and profit targets. This means traders can also place stop-loss orders and minimise potential losses. Different Forex trading chart patterns are available for traders to utilise; some signal you to enter or exit the market immediately, while others help identify market trends. Throughout this article, we will explore five Forex trading patterns to watch out for that help them analyse future market price movements and ultimately make better trade decisions.
Head and Shoulders Chart Pattern
Firstly, Forex traders should watch for the 'head and shoulders' chart pattern. This Forex trading chart pattern is used to predict a downward market situation. For example, it does by helping traders analyse whether a currency pair will fall, in what intervals, and how much it will affect its price. To spot the 'head and shoulders' chart pattern, you should look for two price highs before and after a significant price high. This allows traders to make an exit choice to minimise potential losses and, in turn, makes it one of the most crucial Forex trading chart patterns to keep an eye out for. However, it's important to note that not all 'head and shoulders' chart patterns are reliable; waiting for confirmation of the way is always recommended before taking any action.
Candlestick Chart Pattern
Perhaps the most well-known forex trading chart pattern is the 'candlestick.' This is used in Forex to predict a currency pair market movement. It helps traders analyse whether a market is moving in an upward or downward direction through the opening price, closing price, high price, and low price. For example, when a candlestick indicates an upward movement on a Forex chart, it signals traders to enter the trade as quickly as possible to maximise profits.
Conversely, when the candlestick indicates a downward moment, it highlights to the trader to exit the trade as fast as possible to minimise their losses. It would be best to watch out for the candlestick chart pattern on forex brokers that allow high-volume trading, as there will be plenty of opportunities to see it in action.
Double Top Double Bottom Chart Pattern
The double bottom double top chart pattern consists of two high prices (double top) or two low prices (double bottom) of the currency pair and indicates trend reversals. Why is this a critical chart pattern for traders to look out for? Because when a currency pair reaches an all-time high price twice, it signals to the trader a downward market movement, meaning an exit from the current position is needed to minimise losses. Furthermore, suppose a currency price reaches an all-time low twice. In that case, it indicates to a trader that there will be an upward market movement, which essentially means a sell position on the current market. Remember, while the 'double top double bottom' chart pattern provides valuable insights, it isn't foolproof. It should be combined with other technical analysis indicators and tools before proceeding with a trading entry or exit.
Inverse Head and Shoulder Chart Pattern
So, we have touched on the 'head and shoulder' chart pattern. Now, we will explore the 'inverse head and shoulder' Forex chart pattern. This chart pattern is used to predict an upward movement, helping traders expect how much the price of a currency pair will rise in the future alongside what intervals. For example, this leads to traders making entry decisions in the market, hopefully maximising their profits. Watch out for two price lows before and after a significant price low in the forex chart pattern, as this usually indicates a price rise hereafter. It's crucial to note that not all 'inverse head and shoulder' ways lead to successful reversals. Forex traders should always use proper risk management techniques and look out for other technical indicators or factors before making trading decisions based on this pattern.
Cup and Handle Chart Pattern
The 'cup and handle' chart pattern indicates bearish movements in the Forex market, which then converts into a bullish trend. This Forex chart pattern is used to identify the price points for traders to go long or enter the market. This pattern can exist in the market for months and resembles a 'U' shape cup followed by prices that trade close to one another, making it a handle that resembles a 'V.' Traders should watch out for this pattern as it suggests the market is taking a break before resuming upward momentum. Nevertheless, Forex traders should note that the 'cup and handle' pattern should be used alongside their analysis and other indicators.
Conclusion: Use Forex Charts to Your Advantage
Traders should always conduct thorough research on Forex charts to help guide them through entry prices and exit processes to minimise the risk. By studying historical price movements, traders can make more informed decisions on which Forex chart patterns to watch out for to analyse future price movements.


