TSX in red for 6th straight day but tech & healthcare gain, loonie down

2 min read | May 13, 2022 07:30 AM AEST | By Sundeep Radesh

The TSX Composite Index fell for the sixth day in a row as it lost 138.20 points, 0.7 per cent, to 19,699.05 Thursday, May 12. Tech, however, gained 1.8 per cent and healthcare was up 3.8 per cent.

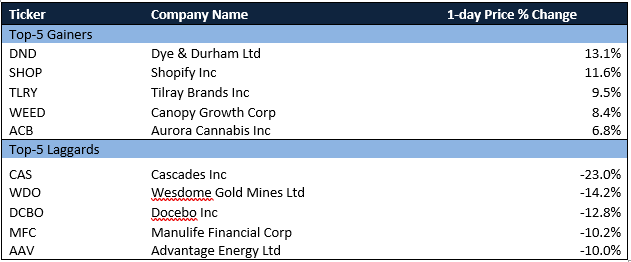
All the other sectors were in the red including energy, down 1.3 per cent, and financials 1.6 per cent. Base metals lost 2.1 per cent as a bearish sentiment seems to continue with speculation of a recession becoming part of the narrative. Dye & Durham’s DND stock spiked 13.1 per cent.

One-year price chart (May 12). Analysis by © 2022 Kalkine Media®

Volume actives

Enbridge Inc saw 19.4 million shares traded, making it the most active stock. It was followed by Manulife Financial Corporation that saw over 18.6 million shares switch hands, and Cenovus Energy Inc saw 8.4 million shares traded.

Movers and laggards

Wall Street updates

On Wall Street, inflation still seems to be part of the narrative. The Dow ended lower by 103.81 points, 0.33 per cent, to 31,730.30 points, while the S&P 500 was down 5.1 points, 0.13 per cent, to 3,930.08 points. Nasdaq’s benchmark grew 6.73 points, 0.06 per cent, to 11,370.96.

Commodities update

Gold lost 1.57 per cent to US$ 1,824.60. The price of Brent oil fell 0.06 per cent and was at US$ 107.45/bbl and that of crude oil was up 0.4 per cent to US$ 106.13/bbl.

Currency news

The loonie lost 0.39 per cent compared to the US dollar while USD/CAD ended at 1.3044. The US Dollar Index was at 104.78 against the basket of major currencies, up 0.9 per cent.

Money market

The US 10-year bond yield fell 2.38 per cent to 2.855 and the Canada 10-year bond yield was down 3.43 per cent to 2.901.


Disclaimer

The content, including but not limited to any articles, news, quotes, information, data, text, reports, ratings, opinions, images, photos, graphics, graphs, charts, animations and video (Content) is a service of Kalkine Media Pty Ltd (Kalkine Media, we or us), ACN 629 651 672 and is available for personal and non-commercial use only. The principal purpose of the Content is to educate and inform. The Content does not contain or imply any recommendation or opinion intended to influence your financial decisions and must not be relied upon by you as such. Some of the Content on this website may be sponsored/non-sponsored, as applicable, but is NOT a solicitation or recommendation to buy, sell or hold the stocks of the company(s) or engage in any investment activity under discussion. Kalkine Media is neither licensed nor qualified to provide investment advice through this platform. Users should make their own enquiries about any investments and Kalkine Media strongly suggests the users to seek advice from a financial adviser, stockbroker or other professional (including taxation and legal advice), as necessary. Kalkine Media hereby disclaims any and all the liabilities to any user for any direct, indirect, implied, punitive, special, incidental or other consequential damages arising from any use of the Content on this website, which is provided without warranties. The views expressed in the Content by the guests, if any, are their own and do not necessarily represent the views or opinions of Kalkine Media. Some of the images/music that may be used on this website are copyright to their respective owner(s). Kalkine Media does not claim ownership of any of the pictures displayed/music used on this website unless stated otherwise. The images/music that may be used on this website are taken from various sources on the internet, including paid subscriptions or are believed to be in public domain. We have used reasonable efforts to accredit the source wherever it was indicated as or found to be necessary.


AU_advertise

Advertise your brand on Kalkine Media

Sponsored Articles


Investing Ideas

Previous Next
We use cookies to ensure that we give you the best experience on our website. If you continue to use this site we will assume that you are happy with it.