TSX back in green as energy grows over 3%, loonie up 6 days straight

2 min read | September 26, 2021 10:30 PM PDT | By Team Kalkine Media

Canada’s TSX Composite Index moved up Monday, September 27, amid surging oil prices, which drove the energy sector by 3.14%. Additionally, the healthcare and base metal sectors were up ~2.35% and 1.88%.

However, the gains in the TSX Index were capped by falling technology stocks, the TSX Composite technology sector lost 1.23%.  The TSX Composite Index shifted into the green zone, gaining 60.76 points or 0.29% to settle at 20,463.42

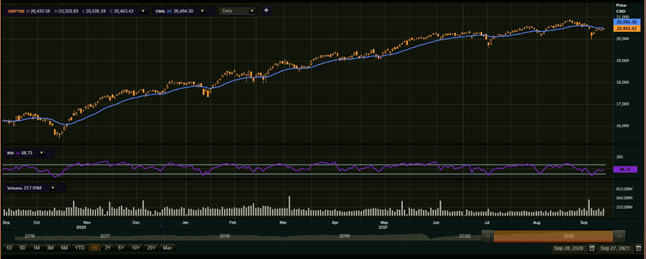
One-year price chart (as on September 27). Analysis by Kalkine Group

Volume active

TC Energy Corp. was the most actively traded stock where 17.22 million exchanged hands, followed by Suncor Energy Inc. where 10.61 million exchanged hands, and Cenovus Energy Inc. with 9.88 million shares exchanging hands.
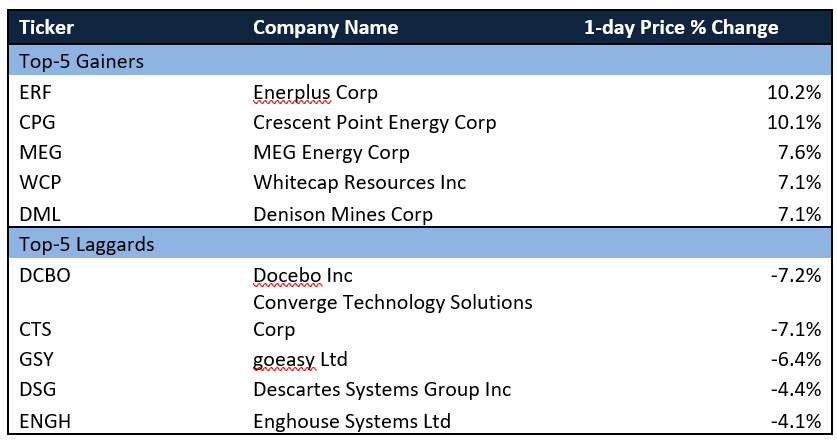
Movers and laggards

Wall Street update

Bond rates in the United States briefly reached 1.5% on Monday as investors fretted about inflation. Since June, yields have been at an all-time high. Investors sought to evaluate the impact of increasing bond rates on US markets, which were mixed.

The Dow finished at 34,869.37, up 71.37 points or 0.21%. The S&P 500 fell 12.37 points or 0.28% to 4,443.11, while the Nasdaq was down by 77.73 points or 0.52% to 14,969.97.

Commodity update

Gold traded at US$ 1,752.00, up 0.13%. Brent oil rose 1.96% to US$ 79.53/bbl, while Crude oil rose 0.83% to US$ 75.45/bbl.

Currency news

The USD/CAD closed at 1.2627, down 0.17%, also the U.S. Dollar index edged higher against the basket of major currencies on September 27, turning green at 93.381, up 0.05%.

Money market

The U.S. 10-year bond yield traded higher on September 27, and ended in the green at 1.491, climbing 1.78%.

The Canada 10-year bond yield also surged on Monday and closed at 1.411, growing 2.62%.


Disclaimer

The content, including but not limited to any articles, news, quotes, information, data, text, reports, ratings, opinions, images, photos, graphics, graphs, charts, animations and video (Content) is a service of Kalkine Media LLC (Kalkine Media, we or us) and is available for personal and non-commercial use only. The principal purpose of the Content is to educate and inform. The Content does not contain or imply any recommendation or opinion intended to influence your financial decisions and must not be relied upon by you as such. Some of the Content on this website may be sponsored/non-sponsored, as applicable, but is NOT a solicitation or recommendation to buy, sell or hold the stocks of the company(s) or engage in any investment activity under discussion. Kalkine Media is neither licensed nor qualified to provide investment advice through this platform. Users should make their own enquiries about any investments and Kalkine Media strongly suggests the users to seek advice from a financial adviser, stockbroker or other professional (including taxation and legal advice), as necessary. Kalkine Media hereby disclaims any and all the liabilities to any user for any direct, indirect, implied, punitive, special, incidental or other consequential damages arising from any use of the Content on this website, which is provided without warranties. The views expressed in the Content by the guests, if any, are their own and do not necessarily represent the views or opinions of Kalkine Media. Some of the images/music that may be used on this website are copyright to their respective owner(s). Kalkine Media does not claim ownership of any of the pictures/music displayed/used on this website unless stated otherwise. The images/music that may be used on this website are taken from various sources on the internet, including paid subscriptions or are believed to be in public domain. We have used reasonable efforts to accredit the source (public domain/CC0 status) to where it was found and indicated it, as necessary.


Sponsored Articles


Investing Ideas

Previous Next