


Highlights
- Ether fared poorly in 2018, which mirrored the price movement of BTC and even stock market
- ETH is a leading altcoin, but other assets may chart their own path during fall in ETH and BTC
- Over the latter half of 2021, ETH doubled, but similar to BTC, volatility can inflict pain anytime
Is it all gloomy in the cryptoverse? Or will there be light for enthusiasts at the end of the tunnel? Simply saying that cryptos would rise from here on or extend losses can be speculative. Is there data to analyze and arrive at a relatively less speculative conclusion?
First, there are a variety of cryptoassets -- meme, gaming, blockchains, and so on. Bitcoin (BTC) holds over 44 per cent share today in the total market cap of cryptoverse. But altcoins’ price movement may not be correlated to BTC price fluctuations. At a time when BTC was losing heavily in the wake of UST stablecoin fall, a few like KNC and ZEC tokens managed to rise.
Among all altcoins -- CoinMarketCap tracks over 19,000 -- Ether is arguably the most popular. ETH share in the total market cap is more than 19 per cent. Today, let’s look at Ether’s 5-year price performance to know how it fared before and amid the pandemic.
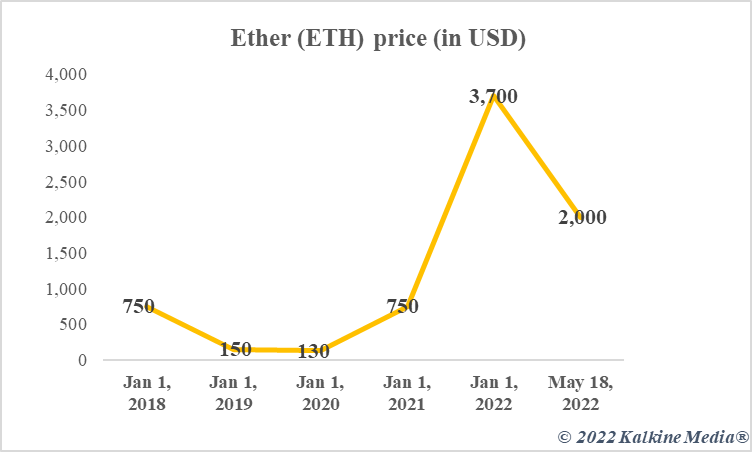
ETH 5-year performance
2017 to 2019
On May 1, 2017, almost five years back, ETH price was nearly US$75. A sustained rally in ETH over much of 2017 resulted in price reaching nearly US$750 by the end of the year.
By mid-January 2018, ETH peaked to nearly US$1,300, before sliding into a dull phase. Price dropped under US$100 by December 2018. In 2019, ETH price stayed below US$300 and exhibited volatility, but price fluctuation was not very wide.
Also read: Bitcoin at $30,000: What does 5-year historical price data indicate?
2020 and beyond
On January 1, 2020, ETH price was nearly US$130. It was in 2020 that ETH rose sharply in the wake of a sustained appreciation in price. 2020 was also the year when the pandemic struck, with Bitcoin also registering sharp gains during the latter half of the year. ETH price on December 31, 2020 was US$750.
In 2021, the surge in price of ETH was sharper than the preceding years. By mid-May ETH had soared to nearly US$4,000. This was also a period when BTC had registered gains, although Bitcoin rally was impacted in April. Between May and June, ETH lost almost half its value.
2021 ended with ETH price at nearly US$3,700. Since then, ETH has remained volatile, similar to BTC and most other cryptoassets including SOL, AXS, and SHIB. As of writing, ETH was nearly US$2,000.
Viewpoint
ETH had its worst year in 2018, something that resembles BTC price movement. In the same year, the S&P 500 Index also fared poorly, which can be viewed as ETH and altcoins’ correlation with the stock market. The year 2021 suggests that ETH price can fall and rise over a short period. From under US$2,000 in June 2021 to over US$4,700 by November, price appreciation was notable. That said, ETH movement has not exhibited uniformity, which suggests that predicting the prices of altcoins can be speculative.
Also read: 3 reasons why cryptos could be crashing
Risk Disclosure: Trading in cryptocurrencies involves high risks including the risk of losing some, or all, of your investment amount, and may not be suitable for all investors. Prices of cryptocurrencies are extremely volatile and may be affected by external factors such as financial, regulatory, or political events. The laws that apply to crypto products (and how a particular crypto product is regulated) may change. Before deciding to trade in financial instrument or cryptocurrencies you should be fully informed of the risks and costs associated with trading in the financial markets, carefully consider your investment objectives, level of experience, and risk appetite, and seek professional advice where needed. Kalkine Media cannot and does not represent or guarantee that any of the information/data available here is accurate, reliable, current, complete or appropriate for your needs. Kalkine Media will not accept liability for any loss or damage as a result of your trading or your reliance on the information shared on this website.
