


Highlights
- BTC and S&P 500 Index price trajectory was same, but BTC’s growth or fall was very sharp
- BTC can be considered hyper-volatile and such assets are often avoided by risk-averse investors
- This year, BTC is down and so is S&P 500 Index, but the causes behind can be different
Bitcoin (BTC) is popular in the variable-return category of investment assets. A few even call BTC the new “alternative investment” asset. At the same time, however, BTC’s volatility has raised eyebrows.
A few prominent investors -- Warren Buffett included -- point toward lack of utility of BTC. Buffett is one of the closely watched investors by the global community. He, on many occasions, has talked about his liking of the S&P 500 Index. BTC and stocks are different. While the former is a digital currency in the world of blockchain, the latter represent companies like Microsoft and Tesla.
But the recent dip in the cryptoverse has led to many finding any correlation between BTC and stocks. Let’s find out how both fared in the past five years. For this, a look at the returns of the S&P 500 Index should be enough.
2017
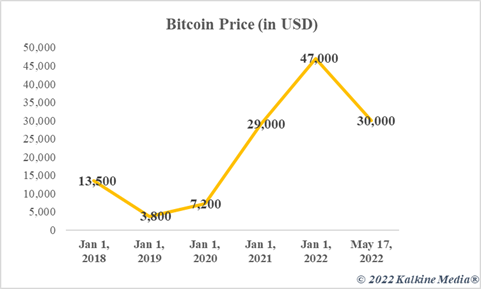
BTC price on January 1, 2017 was nearly US$1,000. By the end of that year, BTC had skyrocketed to nearly US$14,000. This was the kind of return virtually no asset can afford to match. The S&P 500 had surged over 19 per cent during the same period.
2018
This could be one year that may establish a limited correlation between BTC and stocks. By the end of this year, BTC had crashed below US$4,000. Such deep negative returns proved its volatile character.
The S&P 500 Index also declined more than six per cent in the same timeframe. For both BTC and S&P 500, 2018 was the year of losses. Decline in BTC was sharper than in stocks. But since both are variable return assets, it can be said that the same downward trajectory indicates toward some correlation.
Also read: Bitcoin at $30,000: What does 5-year historical price data indicate?
2019-2021
2019, 2020, and 2021 were three years when the S&P 500 Index grew strongly. Growth in 2019 can be termed stupendous. BTC nearly doubled over the same period. 2020 and 2021 -- the pandemic years -- were also largely good for both. After a sudden dip in the wake of COVID-19, markets rose sharply for the remainder of 2020. BTC, in both these years, continued to exhibit wide price fluctuations.
2022
S&P 500 Index is down this year, and so are most other indices like Nasdaq. BTC is on a losing spree as well. It has, after having started at nearly US$47,000, dropped under US$30,000.
Data provided by CoinMarketCap.com
Bottom line
The past five years show that BTC and the S&P 500 price trajectory was in the same direction. However, losses or gains have been sharper in the case of BTC. This is the reason why it is called hyper-volatile. BTC is not the only cryptoasset. Altcoin is another category of assets. But BTC’s mammoth 45 per cent share in the total market cap makes it the most closely tracked.
Also read: ETH at $2,000: What does 5-year historical price data indicate?
Risk Disclosure: Trading in cryptocurrencies involves high risks including the risk of losing some, or all, of your investment amount, and may not be suitable for all investors. Prices of cryptocurrencies are extremely volatile and may be affected by external factors such as financial, regulatory, or political events. The laws that apply to crypto products (and how a particular crypto product is regulated) may change. Before deciding to trade in financial instrument or cryptocurrencies you should be fully informed of the risks and costs associated with trading in the financial markets, carefully consider your investment objectives, level of experience, and risk appetite, and seek professional advice where needed. Kalkine Media cannot and does not represent or guarantee that any of the information/data available here is accurate, reliable, current, complete or appropriate for your needs. Kalkine Media will not accept liability for any loss or damage as a result of your trading or your reliance on the information shared on this website.
