


Highlights
- Prices of altcoins like ETH have largely mirrored the price trend of BTC in 2022, which shows correlation
- BTC has the biggest share in the total market cap of cryptoverse, which is often referred to as its dominance
- Bitcoin price has exhibited volatility, but historical data shows it can recover in a short span of time, like it did in the latter half of 2021
Cryptoverse’s hyper-volatility is again in the news. Over the past few years, the HODL (hold on for dear life) sentiment gripped a section of enthusiasts. It meant holding a cryptoasset for a longer duration, instead of settling for short-term capital gains. Simultaneously, it meant not selling the asset even in the event of a deep correction or crash.
Cryptos and HODL
Can BTC be a HODL asset? Though the answer can be very speculative, a look at the price performance of Bitcoin over a longer span of time, say a set number of years can shine some light. Hereunder is how BTC has performed in the last five years -- before the pandemic and in the midst of it.
Over the past nearly one week, cryptoassets have lost immense value. But over the same period, Bitcoin has gained at least in one respect. BTC’s dominance, or its share in the total market cap of cryptoverse, is now over 44 per cent, according to CoinMarketCap. In terms of price, however, Bitcoin has mirrored the downward price movement of other cryptoassets.
But what if one considers Bitcoin as a HODL asset? For this, let’s examine BTC’s historical price data.
Bitcoin (BTC) 5-year price movement
2017 and 2018
On May 1, 2017, approximately five years back, BTC price was nearly US$1,500. By the end of 2017, BTC price skyrocketed to nearly US$13,500 on the back of sustained rally throughout the year. In 2018, BTC had a rough start, something that resembles the ongoing year. By the end of first quarter, BTC had dropped to nearly US$7,000.
Overall, 2018 was a pretty bad year for BTC. The price failed to enter five-digit territory. The year 2019 began with price of under US$4,000. This proves that BTC can have a longer-than-expected dull phase than can span many months. Second, 2018 was also a bad year for the S&P 500 Index, which may point toward BTC correlation with the stock market.
Also read: Bitcoin bond and Bividend: 2 new extensions of Bitcoin?
From 2019 to now
In 2019, BTC saw its price surging in the first eight months, culminating in reclaim of US$10,000. But a dip led to price falling to nearly US$7,000 by the end of that year. In 2020, the year when the world was struck by the COVID-19 pandemic, BTC lost in the first quarter. It was after this that a sustained rally took its price to nearly US$29,000 by the end of 2020.
In 2021, BTC largely gained in the initial months, reaching nearly US$63,000 by mid-April. From May till mid-July, the downward slide took BTC price to almost US$30,000. In November that year, Bitcoin reached a record price of nearly US$68,000.
This year, Bitcoin has largely traded in red, and the price nearly US$30,000 as of writing.
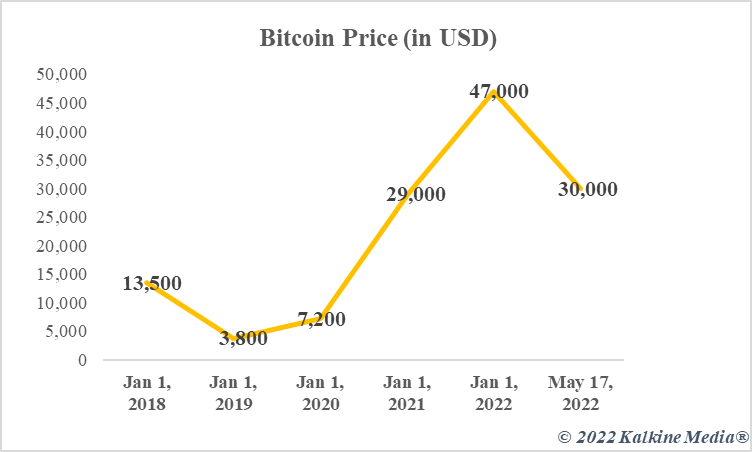
Data provided by CoinMarketCap.com
Also read: 3 reasons why cryptos could be crashing
Viewpoint
The above price analysis of Bitcoin confirms that it can remain subdued over a long stretch as was the case in 2018. 2021 price movement shows that Bitcoin can plunge to US$30,000 and then double over the next three months. But there is no uniformity in how BTC price moves, both in short-term and long-term.
Risk Disclosure: Trading in cryptocurrencies involves high risks including the risk of losing some, or all, of your investment amount, and may not be suitable for all investors. Prices of cryptocurrencies are extremely volatile and may be affected by external factors such as financial, regulatory, or political events. The laws that apply to crypto products (and how a particular crypto product is regulated) may change. Before deciding to trade in financial instrument or cryptocurrencies you should be fully informed of the risks and costs associated with trading in the financial markets, carefully consider your investment objectives, level of experience, and risk appetite, and seek professional advice where needed. Kalkine Media cannot and does not represent or guarantee that any of the information/data available here is accurate, reliable, current, complete or appropriate for your needs. Kalkine Media will not accept liability for any loss or damage as a result of your trading or your reliance on the information shared on this website.
