


Highlights
- Rio Tinto Limited (ASX:RIO) witnessed a sharp correction of 23.85% from the high of AUD 120.07 marked on June 08, 2022.
- RIO’s prices have breached its falling trendline resistance which would probably fuel the move even higher.
- Prices of RIO are trading below the trend-following indicator 21-period and 50-period SMA, which may act as resistance.
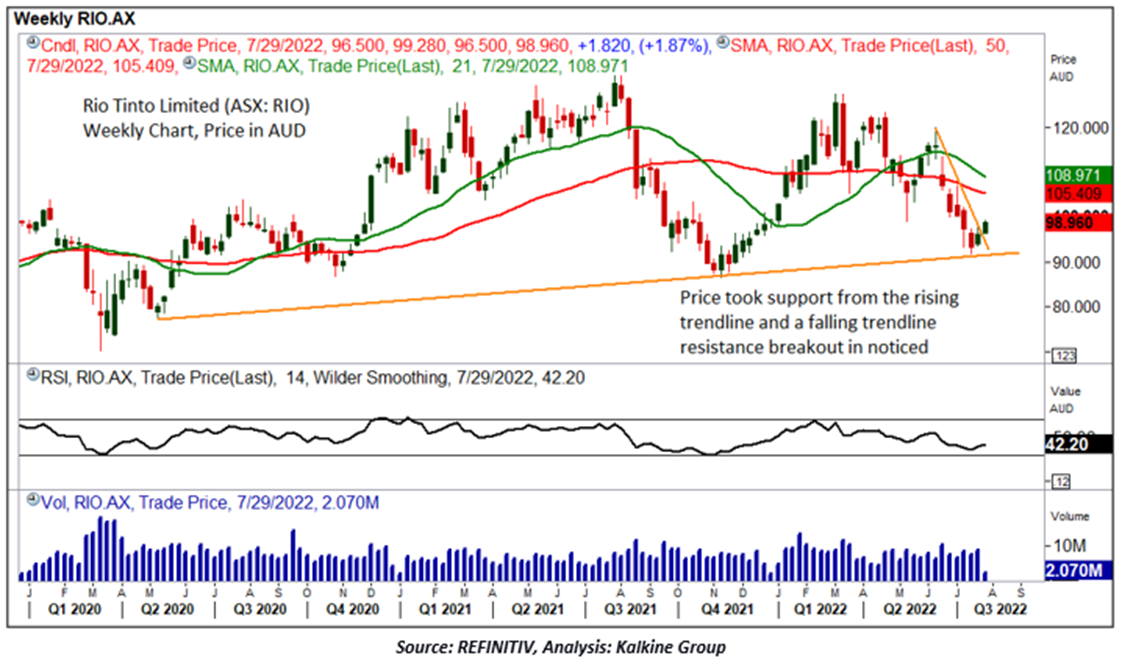
Rio Tinto Limited (ASX: RIO) is an Australia-based mining and metals company operating in many countries across the world. RIO has witnessed a sharp correction of 23.85% from the high of AUD 120.07 marked on June 08, 2022, to the low of AUD 91.91 marked on July 15, 2022. RIO’s prices closed up by 1.87% in Tuesday’s (July 26) trading session and outperformed some of its peers such as Alumina Limited (ASX: AWC) increased by 0.34% and OZ Minerals Limited (ASX: OZL) increased by 1.11%.
Let us now analyse RIO technically for short-term outlook:
On the weekly chart, it has been observed that the prices had taken support from the rising trendline. However, looking at the weekly time frame RIO’s prices have breached its falling trendline resistance which could push the move even higher. The prices of RIO have been reversing from the oversold levels which is shown by the RSI (14-period) when RIO's stock was trading near the lower range with a reading of 35.25. The prices of the stock trading above the breakout zone are accompanied by a rise in volume.
Rio Tinto has invested US$188 million (C$240 million) with an aim to increase the production capacity of low-carbon, high-quality aluminum billets at the Alma Smelter in Lac-Saint-Jean, Quebec by 202,000 metric tons.
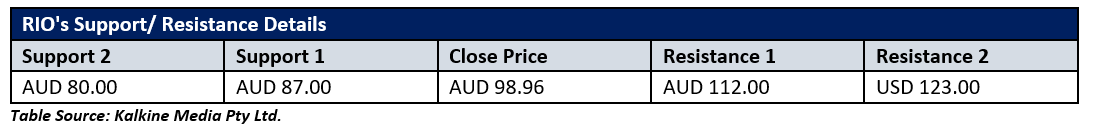
On the positive side, if the prices sustain around the current levels, then the next resistance level may be AUD 112.00 which may act as a next resistance in the near term. On the lower side, important support levels are at AUD 87.00 followed by AUD 80.00. The summary of resistance and support levels are as below:
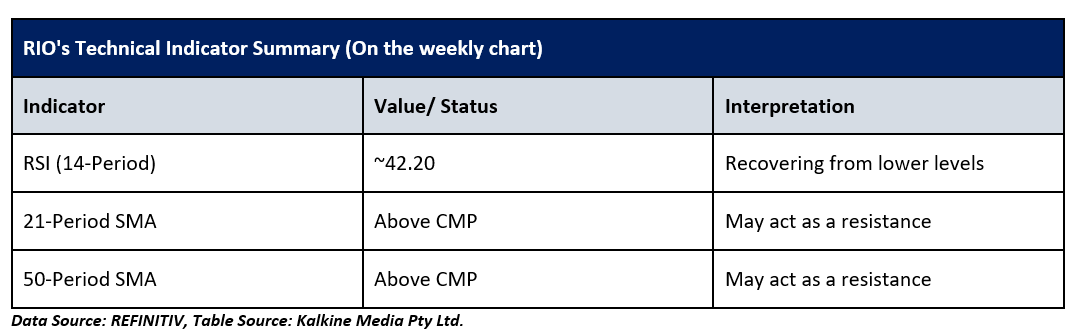
Technical Indicator Analysis (On the weekly chart):
The momentum oscillator RSI (14-period) is recovering from the lower levels and is currently showing a reading of~42.20 levels. However, the prices are still trading below the trend-following indicator 21-period and 50-period SMA, which may act as resistance levels for the stock. The summary of technical indicators is as below:
After analyzing the current price action coupled with the technical indicator, Rio Tinto Limited appears to be recovering from the major rising trendline. A sustainable upside move from the current level may test its initial resistance and a downside move below the support levels might bring some correction for the stock.
