

Summary
- Iron ore prices have rallied considerably in the recent past, supporting ASX-listed iron ore miners and companies like Mineral Resources Limited (ASX:MIN), that hold exposure to the commodity.
- MIN has delivered a total return of 41.14 per cent over the last one-year.
- The stock has relatively outperformed the benchmark index- S&P/ASX 200 and the sectoral index of S&P/ASX 200 Resources.
- The Company withstood the COVID-19 outbreak impact and performed well during the third quarter of the financial year 2020.
- MIN has updated the production outlook for FY20, based upon an optimised mine plan, which includes a lower processing throughput to achieve a higher yield from ore processed while keeping its Wodgina lithium JV on care and maintenance.
- While the stock has been in a consistent rally so far, it is now showing some peculiar development on charts.
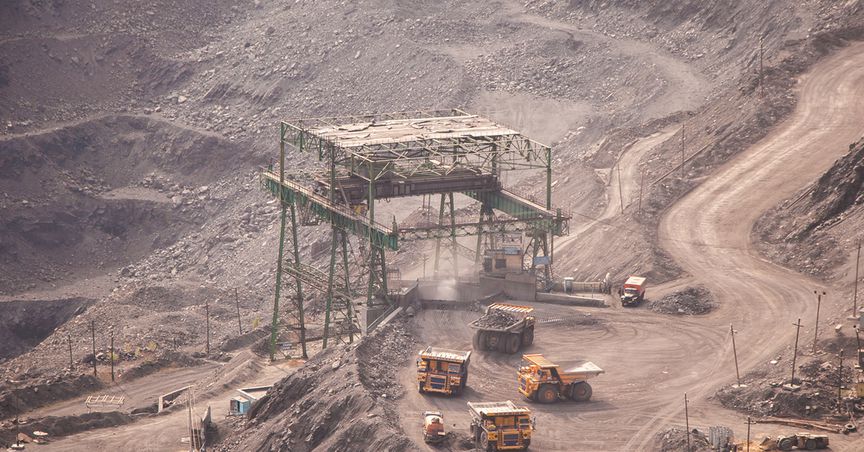
Mineral Resources Limited (ASX:MIN) is an ASX-listed multi-business company whose core business pillars include Mining Services, Commodities, Profit-Share Projects, Innovation & Infrastructure, and Energy.
The stock of the Company is presently riding over the iron ore rally, multi-business prospect, and lower energy prices, keeping it relatively immune to the COVID-19 outbreak, which has laid drastic challenge in front of many miners.
To Know More, Do Read: Iron Ore Futures Predisposed to China’s Steel Industry Revival
Performance

MIN, S&P/ASX 200, S&P/ASX 200 Resources Total Return Over the Last One Year (Source: Refinitiv Eikon Thomson Reuters)
Over the last one year, Mineral Resources has delivered a total return of 41.14 per cent to relatively outperform the S&P/ASX 200 Index and the sectoral index of S&P/ASX 200 Resources by a huge margin, which had remained in pressure due to the COVID-19 outbreak.
From the above chart, it could be assessed that the Company also witnessed the early impact of the COVID-19 shift from an epidemic to a pandemic; however, the third quarter of the Company remained fruitful, and the stock recovered on the exchange to first deliver a positive return while later moving ahead further to deliver superior return against the parent and sectoral index on ASX.
Recent Quarterly Performance
The COVID-19 outbreak did not materially impact operations of the Company during the third quarter of the financial year 2020 with mining services segment performing well. MIN anticipates the second half EBITDA from the mining service segment to stand at $172 million, unchanged as compared to the first-half of FY2020.
Iron Ore Segment: The iron ore production during the third quarter of FY2020 remained 3 per cent higher against the previous quarter and 28 per cent higher against the previous corresponding period, which coupled with surging iron ore prices supported the stock on the exchange.
While the mining at Koolyanobbing remained largely impacted from heavy rainfalls, MIN commenced mining operations during March 2020 at Mt Jackson pits to open up ore tonnes in order to position the mine for achieving the fourth quarter ramp of up to 11.0 million tonnes per annum.
Lithium Business: The Wodgina lithium JV with the global giant- Albemarle is put on a standstill and maintenance due to the challenging global lithium market conditions and to preserve its world-class spodumene ore bodies.
The Company suggested that it would monitor the global lithium front with a view of resuming spodumene concentrate production as and when required.
Furthermore, MIN mined 591k tonnes of spodumene during the third quarter of FY2020 at Mount Marion, which remained 26.49 per cent down against the previous quarter and 21.92 per cent down against the previous corresponding period.
However, the shipment remained unchanged against the previous quarter to stand at 99k tonnes.
Apart from that, MIN updated the production outlook for FY20, based upon an optimised mine plan, which includes a lower processing throughput to achieve a higher yield from ore processed.
The snippet of the Recent Quarter Production and Shipment is as below:

Source: Company’s Report
Price Action and Market Behaviour
The stock is under a consistent rally from the level of $12.11 (intraday low on 23 March 2020) and has witnessed a price appreciation of ~ 74.97 per cent from its low to the recent high of $21.19 (intraday high 11 June 2020).
Post appreciating considerably, the stock is currently hovering in a range between $21.00 to $20.00.

MIN Daily Chart (Source: Refinitiv Eikon Thomson Reuters)
On following the daily chart, it could be seen that the stock is currently at its trendline support and is trading around the mean value of the 20-day simple Bollinger band after testing the +1 Standard Deviation.
At present, the stock is trading above the medium-term exponential moving average of 200-day and 50-day, reflecting that the major trend is an uptrend. However, there are some peculiar developments on charts, which should be monitored closely to reckon the future direction.
First, the 12,24,9 MACD indicator is giving a negative signal, while from past few trading session the down candle is followed by large volume while an up candle is followed by weak volumes, which could be an early sign of the beginning of the secondary or the corrective phase.
However, the stock needs to slip below various support levels to confirm the same. The immediate support for the stock is at the trendline, which is merging with the mean value of the Bollinger band (20-day simple moving average), followed by the -1 SD of the Bollinger band, which is overlapping with 50-day EMA, and hence, is decisive.

MIN Daily Chart (Source: Refinitiv Eikon Thomson Reuters)
On applying the +- DI on the daily timeframe, it could be seen that the DIs are now showing a negative cross, albeit are yet small distance apart. After observing the past trend in the DI, it could be seen that the DI had previously given the same signal, but failed to distance apart, and the stock resumed its uptrend.
A divergence between the price action and the 14-day Relative Strength Index could also be seen on the daily chart with prices sloping upwards and RSI sloping downwards while the Average True Range is low, which could seed bearish sentiments in the short-term.
