


Summary
- S&P/ASX 200 A-REIT is now entering a consolidation phase post showing a decent recovery since the beginning of the second quarter.
- The index was under consolidation between 1,200 to 1,300 levels, and currently is hovering around 1,308 levels.
- The ongoing consolidation in the index is now getting further reflected upon some of its stocks with some REITs such as Scentre Group (ASX:SCG), Vicinity Centre (ASX:VCX) recovering from their recent loss and entering a consolidation phase.
- REIT stocks – Scentre and Vicinity Centre on charts.
The property market took a breather from the deep fall instigated by the COVID-19 outbreak with S&P/ASX 200 A- REIT recovering since the onset of the second quarter and attempting a volatility breakout during the past few trading sessions.
To Know More, Do Read: S&P/ASX 200 A- REIT Attempts Volatility Breakout – GMG, CHC, and DXS
However, in its attempt on volatility, the S&P/ASX 200 A-REIT has now entered a consolidation phase with the index hovering in a narrow range of 1,200 to 1,300.
The ongoing consolidation in the index has had the same effect on some of constituent stocks with some companies such as Scentre Group (ASX:SCG), Vicinity Centre (ASX:VCX) recovering from their recent loss and entering a consolidation phase.
Scentre Group (ASX: SCG)
Scentre Group reported revenue of $1,094.1 million for the half-year ended 30 June 2020, which remained 16.0 per cent down against the previous corresponding period (or pcp).
- Each component of the total revenue witnessed a declined against pcp with property revenue dropping by ~ 8.50 per cent to stand at $997.1 million; and,
- Revenue from property development and construction tumbled by ~ 61.40 per cent to stand at $71.4 million; and,
- Income from property management declined ~ 8.89 per cent to stand at $25.6 million.
The group reported a net loss after tax of $3,657.4 million for the period, which remained significantly down against an NPAT of $744.0 million in the previous corresponding period.
The comprehensive loss for the period reached $3,668.6 million against an NPAT of $745.0 million for the second half of the financial year 2019.
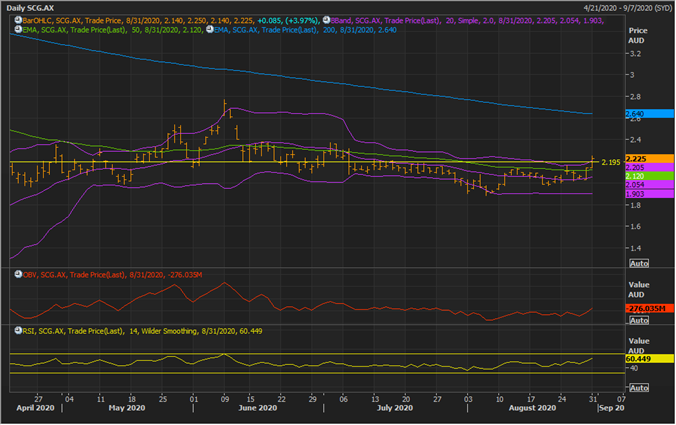
SCG Daily Chart (Source: EODHD/Others Eikon Thomson Reuters)
As the S&P/ASX 200 A- REIT index is attempting for a volatility breakout, some of the underlying stocks are also trying the same, and it could be seen on the daily chart that, SCG is currently hovering around the +2 Standard Deviation of the 20-day simple Bollinger band.
- In the past trading sessions, the stock crossed the 50-day exponential moving average (EMA) and attempted a volatility breakout; however, failed to sustain the breakout and corrected.
- While taking a correction, just like the parent index, the stock entered a phase of consolidation, and at present, SCG is hovering around the 50-day exponential moving average with a downward slope.
- The stock is currently trading below the 200-day EMA, reflecting that bears are currently dominating the front.
- However, the 20-day Bollinger band is now squeezing with the consolidation, which coupled with a rising 14-day Relative Strength Index (or RSI) and On Balance Volume, suggest that the stock might soon gain a directional momentum.
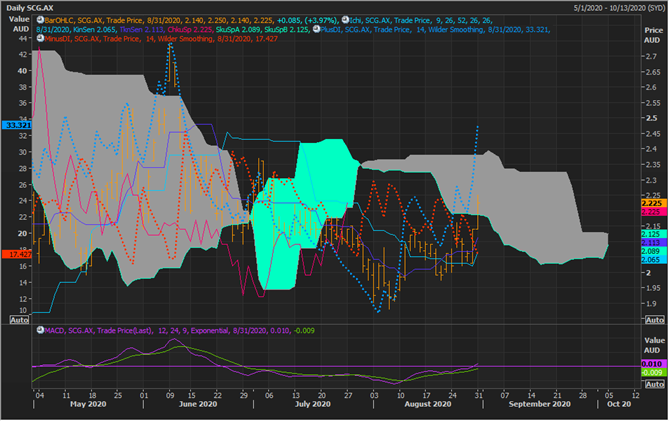
SCG Daily Chart (Source: EODHD/Others Eikon Thomson Reuters)
On applying the Ichimoku Kinko Hyo on the daily chart, it could be seen that the pair of the conversion line and the base line is giving a positive cross with the conversion line crossing the base line from below.
- However, the crossover took place below Span A, reflecting that though bulls are trying to take the price up, bears are currently dominating.
- Also, as Span A is trading below Span B, the primary trend is identified as a downtrend.
- The major resistance for the stock is at the grey could area, a break and sustain above which could seed bullish sentiments.
- The recent low should act as immediate support for the stock.
- The leading directional signals are showing a positive signal with the plus DI crossing the minus DI from below, which coupled with a positive signal from the 12,24,9 MACD is suggesting that bulls are quite active around the current consolidation zone.
Vicinity Centre (ASX:VCX)
The Company reported a net loss after tax of $1,801.0 million for FY2020, which remained substantially lower against an NPAT of $346.1 million for the prior year.
- FY2020 funds from operations declined by ~ 24.51 per cent against pcp at $520.3 million.
- Moreover, the Company suggested that the net loss was offset by a property valuation loss of $1,717.9 million and an impairment of goodwill of $427.0 million.
- Furthermore, the revenue and profitability took a hit from the COVID-19 outbreak, prompting the group to provide rental waivers to tenants, which was partly offset by cost-saving initiatives implemented by the Company.
- The distribution per security for the period declined by ~ 51.57 per cent against pcp to stand at 7.7 cents.
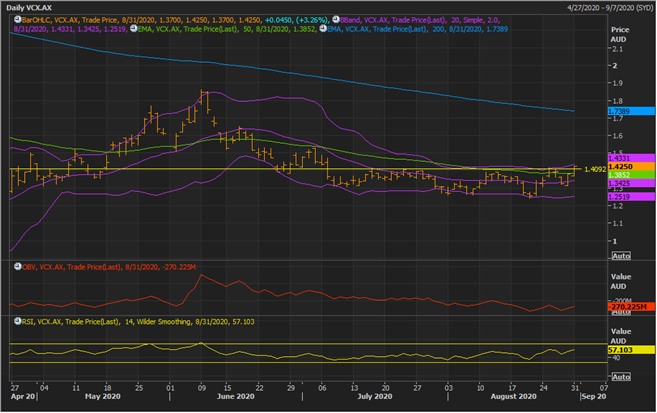
VCX Daily Chart (Source: EODHD/Others Eikon Thomson Reuters)
On following the daily chart, it could be seen that the stock is showing a similar price behaviour as compared to its peer group with VCX hovering near the +2 Standard Deviation of the 20-day simple Bollinger and taking the support of 50-day EMA.
- Just like SCG, the 20-day simple Bollinger band for VCX is also shrinking, which coupled with an upward slope in 14-RSI is suggesting that the stock might soon gain a directional momentum, to break the ongoing consolidation phase.
- However, the participation from bulls is now losing steam, which could be inferred by witnessing the divergence between the price and On Balance Volume with the price reaching a new high while OBV is hovering below the previous peak.
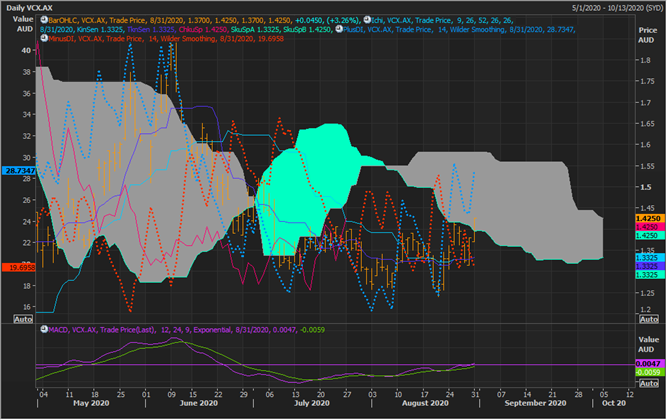
VCX Daily Chart (Source: EODHD/Others Eikon Thomson Reuters)
After applying Ichimoku on the daily chart, it could be seen that the stock is currently testing the resistance of the grey cloud or Span A.
- At present, the pair of the conversion line and the base line is showing a positive cross; however, as the crossover took place below Span A, which itself is below Span B, it could be inferred that bears are currently dominating the front.
- The pair of directional signals are now showing a negative signal with minus DI slipping below the plus DI from above.
- However, the 12,24, 9 MACD is showing a positive signal.
- The mixed-bag signals are currently reflecting on the ongoing tug-of-war between bulls and bears.
- A breach and sustain above the grey cloud area could seed bullish sentiment ahead, while failure to do so could seed bearish sentiment.
