


Highlights
- The S&P/ASX 200 Energy Index (XEJ) gained 1.55% to trade at 10,149.5 on Tuesday.
- XEJ has increased staggeringly due to a solid recovery in commodity prices, amid soaring demand.
- Diversification is the fundamental principle of investing that reduces risk by allocating investments across various sectors.
Australian Energy Index, the S&P/ASX 200 Energy Index (XEJ), has outperformed many other indices in the last one year. As of Monday, the index offered an extraordinary 52-week return of 27.07%. The index tracks the performance of the 200 largest energy stocks on the ASX by float-adjusted market capitalisation.
On Tuesday, the S&P/ASX 200 Energy Index (XEJ) gained 1.55% to trade at 10,149.50. Looking at the multi-year chart, it seems like the Energy index stands at its multi-year resistance level. The index is nicely consolidating at this point from last three weeks.
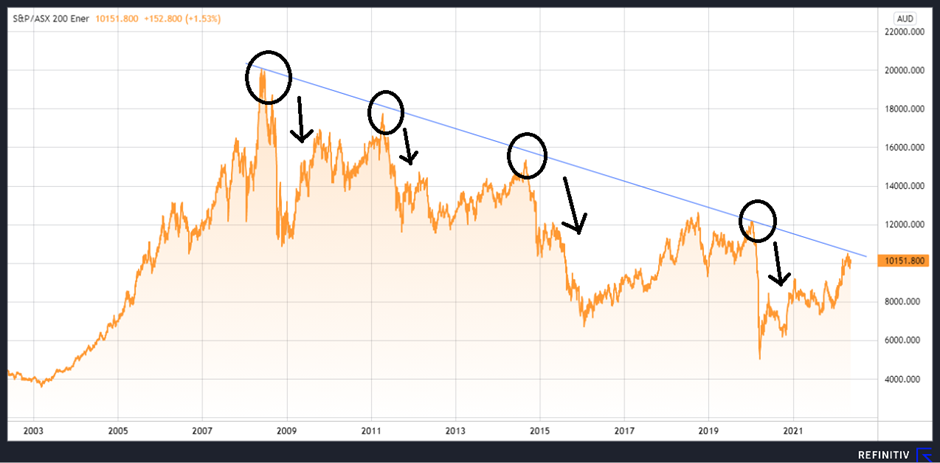
The S&P/ASX 200 Energy Index (XEJ) | Chart Source: EODHD/Others Eikon
The index has made significant corrections every time it reached the demarcated resistance level. Market participants would be closely tracking price action as multi-year trendlines are considered important by many technical analysts.
Energy Index Performance
In 2022, the performance of the energy index outperformed its peers. While the benchmark S&P/ASX All Technology Index dipped 29.82%, XEJ has gained staggeringly due to a solid recovery in commodity prices.
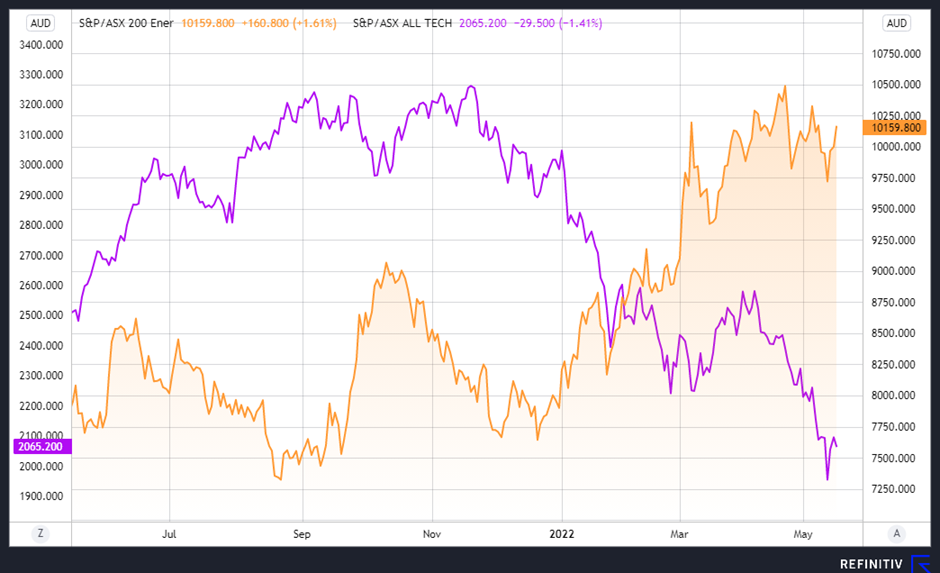
Comparative chart of S&P/ASX 200 Energy Index & S&P/ASX All Technology Index | Chart Source: EODHD/Others Eikon
With the onset of 2022, technology stocks struggled to keep up their performance pace, however, energy stocks enjoyed their bull run with a solid recovery in crude oil prices, the primary driver of the index.
Furthermore, supply disruptions caused due to the ongoing Russia-Ukraine war have also helped commodities to record a robust rally in the first half of 2022.
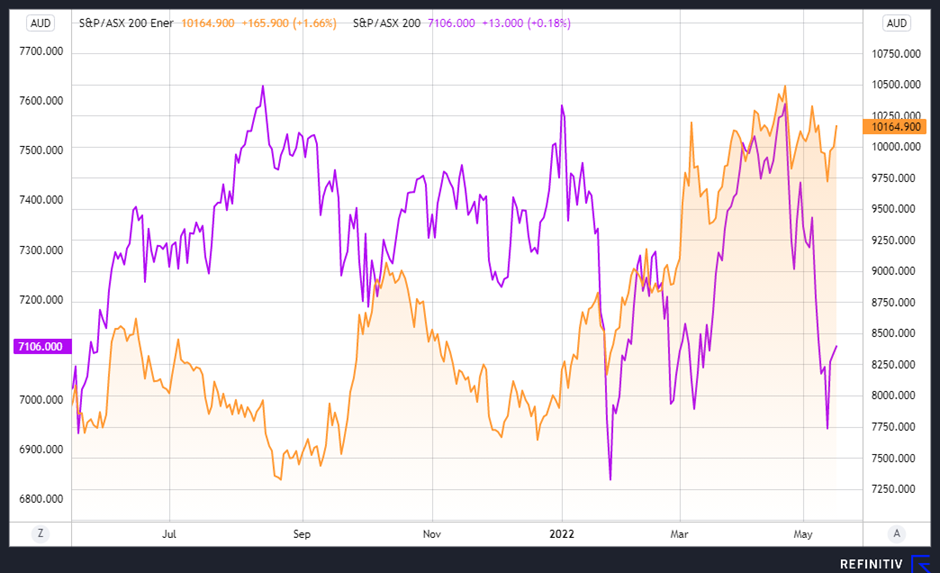
Comparative chart S&P/ASX 200 Energy Index & S&P/ASX 200 | Chart Source: EODHD/Others Eikon
The S&P/ASX All Technology Index was not the only index to be outperformed by the energy index, it also performed better than the S&P ASX 200 index, which tracks the performance of Australia's 200 largest stocks.
Let's have a glance at the performance of all three indices with the help of the following table.

Diversification and its importance
Diversification is the fundamental principle of investing that reduces risk by allocating investments across different sectors. The technique aims to maximise returns by investing in diverse areas that would react uniquely to the same event. At the same time, it also reduces investment risk.
The above-stated theory becomes true when we apply it to the three-year data.
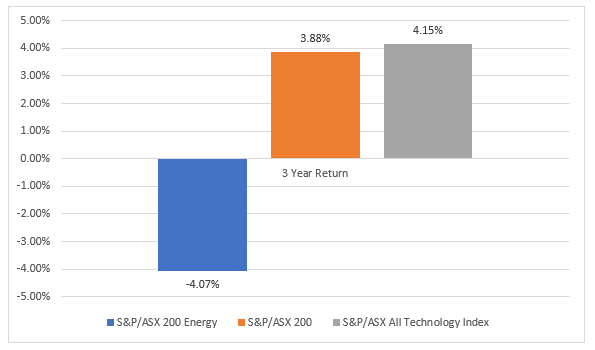
3-Years return of all three indices
Source: ASX as of 16 May 2022
The results show that the technology was the best performer if we consolidate last three-year returns, and the energy index becomes the worst performer. However, earlier, we have seen that XEJ was the best performer among the three when we consider the data for 2022 for analysis.
This implies that relying on a single sector can be a risky affair for an investor and diversification could help them to maximise their returns.
