


Navigator Global Investments Limited (ASX: NGI)
Alternative asset manager, Navigator Global is an Australian registered company. It operates through its subsidiary Lighthouse Investment Partners, LLC. Also, NGI is a constituent of All Ordinaries Index, S&P/ASX 300, and S&P/ASX Small Ordinaries.
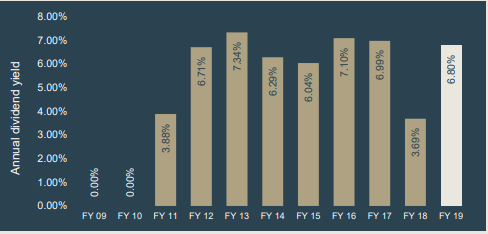
Annual Dividend Yield (Source: FY19 Results Presentation)
The asset manager released the full-year financial results for the year FY19 on 8 August 2019. Subsequently, it announced an unfranked dividend of US 9 cents per share payable on 30 August 2019. The dividend would go Ex on 14 August 2019 with scheduled record date on 15 August 2019. Besides, the recent dividend takes the total dividend for the FY19 to US 17 cents per share.
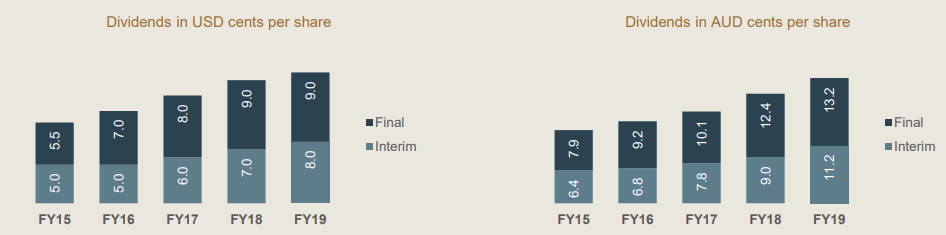
Dividends USD & AUD (Source: FY19 Results Presentation)
Reportedly, the company has a policy of paying a dividend of 70-80% of the EBITDA, and the policy allows the company to retain some portion of the cash from operating activities. Besides, the retained portion allows the company to make investments in funds, to improve the operating interest of the company while also capitalising on external investment or acquisition.
Revenues, Expenses & Profit
Financials (All figures in USD, unless or otherwise stated)
The annual report of the company provides a deep insight into the business performance of the company and the developments that occurred during the financial year. Accordingly, the company clocked management fee revenue at $105.4 million in FY19, up by 40% compared with $75.5 million in FY18. The growth in the management fee revenue was driven by growth in average total assets under management (AUM). Interestingly, the company witnessed a decrease in overall average management fee rate, which came down to 0.68% p.a. for FY18, against 0.73% p.a. for FY19. Besides, the lower fee rates depict impacts from the elimination of distribution expense by a long-term distribution partner.
Reportedly, the performance feesâ revenue took a hit by 85% to reach $1.1 million in FY19 compared with $7.6 million in FY18, which equates to a fall of $6.5 million. The performance fees were down due to the subdued investment performance across the portfolio, which is directly correlated with the performance fee revenue of the company. Besides, the company had reported a substantial increase in other revenue streams, and the total revenues of the company reached to $114.86 million in FY19, up by 28% compared with $89.57 million in FY18.
Consistent with Annual Report, the total expenses of the company soared by 38% to reach $77.24 million in FY19 compared with $56 million in FY18. Notably, the increase in information and technology, professional and consulting, and employee expenses was higher.
Consequently, the EBITDA for the FY19 was $37.65 million, up by 10% from $34.21 million in FY18. Also, the net profit after income tax was $26.84 million in FY19, compared with a loss of $13.05 million in FY18. Subsequently, the company generated basic/diluted EPS of 16.55 cents in FY19 against a loss of 8.05 cents in FY18.
Consistent with the Annual Report, the previous year marked a loss due to the spur in income tax expenses of the company which reached to $35.5 million in for 30 June 2018, and it was related to the restatement of the companyâs deferred tax assets due to a decrease in the US Federal income tax rate from 35% to 21%. Admittedly, the company has no tax payable regarding the accounting tax expense except a few nominal United States state-based taxes due to the significant tax losses available to off-set its tax liabilities.
Balance Sheet
As per the release, the balance sheet of the company appears strong with cash at $29 million driven by $22.6 million from operating activities. Notably, the company paid $27.5 million in dividends, $1.6 million for investments, $1.5 million paid for plant & equipment. Besides, the company had $19.4 million in trade and other receivables, which involves management and performance fees receivable.
Meanwhile, the companyâs liabilities stood at $6.7 million out of which 59% of the liabilities are current. Further, the liabilities comprises of $6 million of trade & other payables, $0.7 million of employee benefit provisions. Importantly, the company is debt-free and has a $15 million line of credit, which is undrawn.
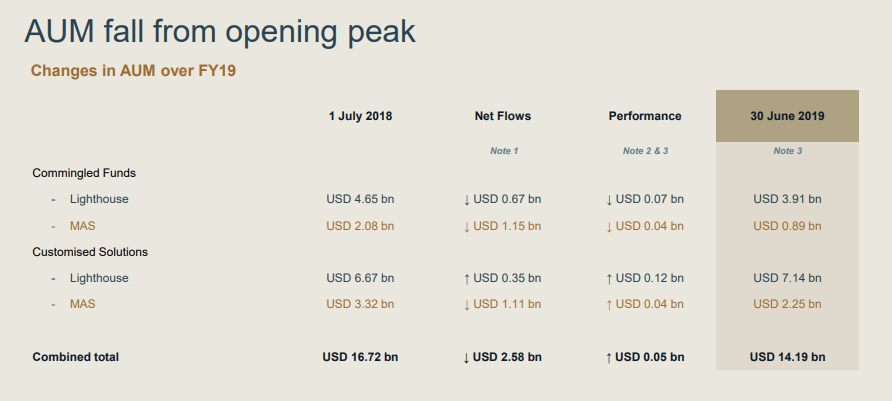
Assets Under Management
Reportedly, the company had $14.2 billion in assets under management (AUM) as of 30 June 2019. Also, the opening AUM of the company as at 1 July 2018 was recorded at $16.7 billion, which was a milestone. In the previous year, AUM depicted an excellent year of asset raising and the transition from acquired client relationships from MAS worth $5.4 billion. Besides, the company witnessed higher than normal net outflows dragging the AUM to $14.2 billion, which were witnessed across businesses. Subsequently, the total net outflows accounted for $2.6 billion for the FY19.
As per the release, the major portion of the decrease in AUM was driven by redemptions from the transitioned MAS relationships, which accounted for $2.3 billion throughout the year. Also, the commingled funds and customised solution client segment saw redemptions accounting for approximately $1.1 billion. Besides, the company expects stabilisation of MAS customised clients over the next 12 months.
Meanwhile, the Lighthouse Customised Solutions funds had net inflows of $350 million for the year, and Lighthouse Commingled funds suffered net redemptions of $670 million. Further, the major portion of redemption in the Lighthouse segment was driven by Global Long/Short Funds.
AUM Performance (Source: FY19 Results Presentation)
Importantly, the company witnessed a significant reduction in investment performance during the first-half of the year resulting in a decrease in AUM by $680 million. However, it recovered from the suffered losses, during the second half of the year resulting in a $50 million increase to AUM via investment performance for the full year.
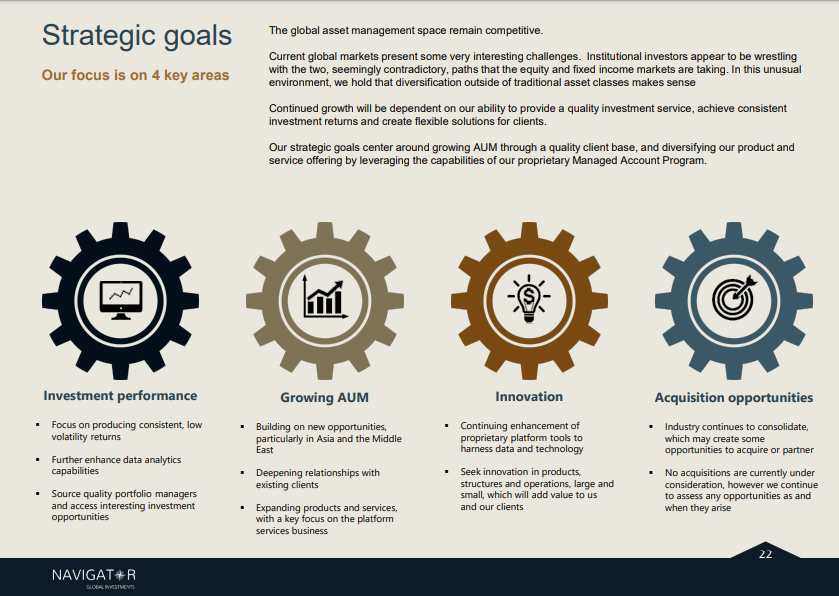
Strategic Goals (Source: FY19 Results Presentation)
On 8 August 2019, NGIâs stock last traded at A$3.38, up by 6.962% from the previous close. The stock of the company has provided a negative return of 42.96% over the past one-year period. Besides, it has picked up by giving a positive return of 7.12% over the past six months. The market capitalisation of the company is ~A$512.39 million, with ~162.15 million shares outstanding.
Disclaimer
This website is a service of Kalkine Media Pty. Ltd. A.C.N. 629 651 672. The website has been prepared for informational purposes only and is not intended to be used as a complete source of information on any particular company. Kalkine Media does not in any way endorse or recommend individuals, products or services that may be discussed on this site. Our publications are NOT a solicitation or recommendation to buy, sell or hold. We are neither licensed nor qualified to provide investment advice.
