


Medibank Private Limited (ASX: MPL) is a financial and a well-established private health insurance provider. With over 40 years of experience, the company provides other services such as preventative integrated primary care and mental health support. It has spread its business across other insurance avenues like life, pet and travel insurance support.
On 30th April 2019, the company released a presentation on its business operations at Macquarie Australia Conference. The company reported its 1HFY19 results, wherein the health insurance operating profit stood at $281.5 million, and Medibankâs health operation profit was reported at $12.6 million.
In the desire to capture the private health insurance sector, the company strengthened its digital member service and automated platform to drive personalised and proactive contacts and support. For the most loyal customers, the company rolled the priority programme. It also expanded to health promotions, including new campaigns.
Technical Outlook
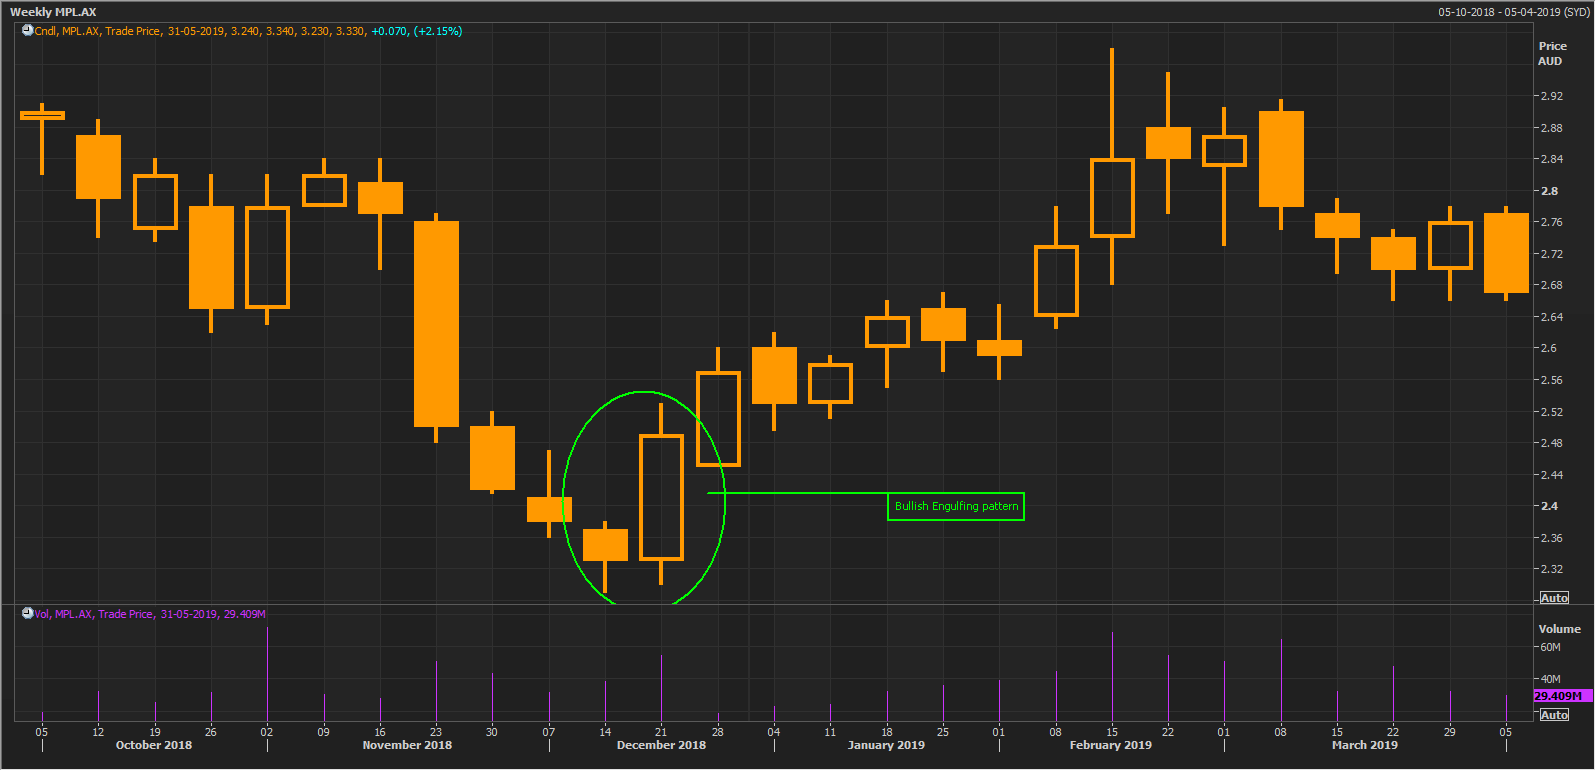
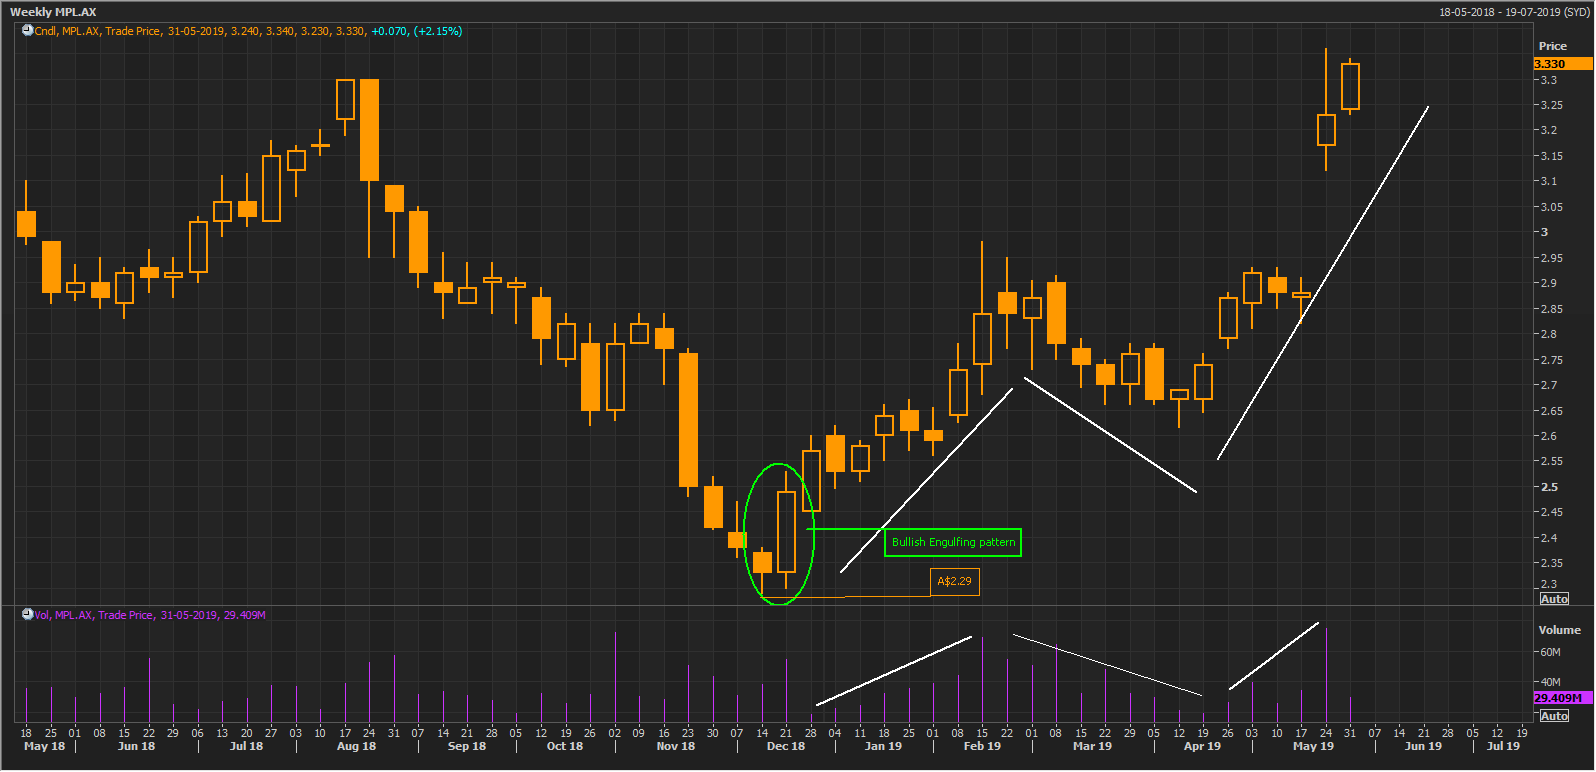
In December 2018 the stock had made its 52-week low price of A$2.29 (valid as of 30th May 2019). In the same month, just a week after the 52-week low had been recorded, the stock price started to inch up from the bottom levels. The price action resulted in the formation of a bullish engulfing pattern.
 Bullish Engulfing pattern on daily chart of Medibank (Source: Thomson Reuters)
Bullish engulfing candlestick pattern is a bullish reversal pattern which generally takes shape at the bottom of a prior downtrend. It is a two-candlestick pattern in which the first candle closes in red (depicting selling), and the immediate next candle opens below the close of the previous day and eventually close in green with the closing price being well above the previous dayâs open and hence covering/engulfing the real body of the previous red candle.
This price action by two candle makes the second candleâs real body larger than the previous candleâs, and hence the pattern gets completed. The bullish engulfing candle on the weekly chart completely reversed the downtrend and post that the stock price surged upside as seen in the chart.
 Daily chart of Medibank (Source: Thomson Reuters)
The stock started rallying until mid-February 2019, supported by a healthy increasing volume as seen in the chart. Increasing volume cements the reliability of the current trend. From mid-February 2019, the stock started to correct, however, purely on a volume analysis basis, one could see that the price correction was taking place with a decreasing volume, suggesting that only weak hands were getting out, and not the strong ones.
After the minor correction, the price started to rise again with the volume increasing with the stock currently trading near its 52-week high levels.
Stock Performance
The company has a market capitalisation of A$8.98 billion, and the stock had touched a 52-week high and low of A$3.36 and A$2.29 respectively. The stock closed the trading session at A$3.33 after making an intraday high of A$3.34 as on 30th May 2019.
Disclaimer
This website is a service of Kalkine Media Pty. Ltd. A.C.N. 629 651 672. The website has been prepared for informational purposes only and is not intended to be used as a complete source of information on any particular company. Kalkine Media does not in any way endorse or recommend individuals, products or services that may be discussed on this site. Our publications are NOT a solicitation or recommendation to buy, sell or hold. We are neither licensed nor qualified to provide investment advice.
