


Summary
- Precious metals space seems to be gearing up with gold vaulting above its previous seven-year high to trade as high as USD 1,779.61 per ounce.
- While gold is riding on the back of various macro developments, from liquidity pumping by central banks, to second wave of COVID-19 outbreak, silver is not lagging behind and closely following the yellow-shine of gold.
- The recent rally in silver marks a return of over 55 per cent, outperforming gold and leading to the decline in the gold-to-silver ratio, which previously indicated that silver is better poised to outperform gold.
- However, tables seem to be turning, with XAUXAG reaching crucial resistance while gold retests its recent channel breakout and silver reaches long-term resistance.
Precious metals are under a sentiment splash with gold prices vaulting another high of USD 1,779.61 per ounce (as on 24 June 2020), surpassing its previous seven-year high of USD 1,765.94 per ounce (as on 18 May 2020).
To Know More, Do Read: Gold Vaults to Highest Levels Since October 2012; Trade Trends and Data Divergence
While the gold market is back in focus on the back of falling risk appetite amongst the market participants, silver is catching up with spot prices surging ~ 55.28 per cent from the level of USD 11.640 per ounce (intraday low on 18 March 2020) to the present high of USD 18.075 per ounce (intraday high on 24 June 2020).
To Know More, Do Read: Silver Outperforms Gold with Over 30% Return; Money Managers Betting on Silver!!
While the silver prices are contouring new multi-year highs, the Silver Institute anticipates that silver prices would average USD 19.0 per ounce during the year over the medium-term; however, considering the rally it would not be surprising if the projection comes true in much shorter span than initially anticipated.
To Know More, Do Read: Silver to Reach USD 19.0 Per Ounce by Year-End- Says The Silver Institute
The sudden rush in gold after a brief consolidation has finally supported the gold-to-silver ratio, which has again swiftly climbed the ladder to reach the level of 100.0.
Gold-To-Silver Ratio
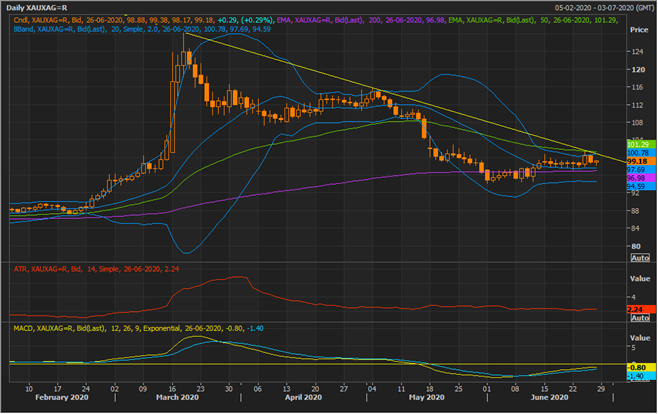
Gold-To-Silver Ratio Daily Chart (Source: EODHD/Others Eikon Thomson Reuters)
On following the daily chart, it could be seen that the ratio is currently trading above its 50-day exponential moving average, reflecting that the secondary trend seems to getting over and the next leg of the breakout is along the primary trend.
However, the ratio is still below its 200-day EMA, which is currently overlapping with the downward sloping yellow trendline and the +1 Standard Deviation of the 20-day simple Bollinger band, suggesting that the ratio would now face a major resistance.
The ability of the ratio to break and sustain above the suggested resistance level or failure to do so would decide further performance of gold as compared to silver. A break above the resistance would indicate a brighter prospects for gold as compared to silver while failing to do so would indicate better silver prices ahead.
Furthermore, the 12,24,9 MACD indicator is giving a positive read, and if breakout takes place ahead it should ideally be followed by the rise in the Average True Range for better confirmation.
Gold on Charts
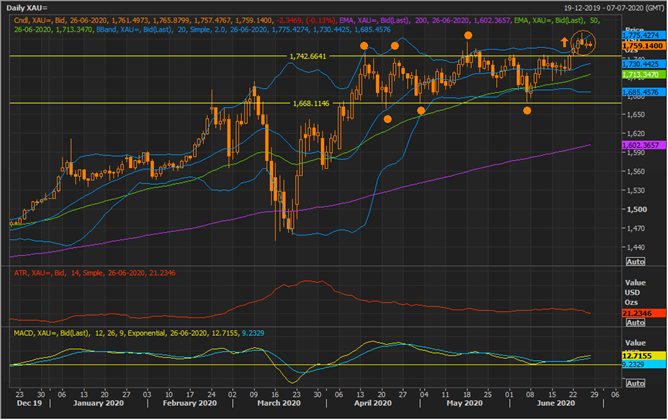
Gold Spot Daily Chart (Source: EODHD/Others Eikon Thomson Reuters)
On following the daily chart of gold, it could be seen that the gold spot took a sideways consolidation in a channel. The channel demonstrated multiple touch points (marked with dots) with every touch on the bottom line of the channel or the support line showing higher low as compared to the previous (bullish indication).
At present, while the major trend in gold remains upwards, confirmed by prices above the pair of both 50- and 200-day EMAs, it is attempting a breakout from the channel and has recently shown an upswing with prices crossing the previous high on momentum.
However, the gold spot is currently finding it hard to maintain the gained momentum with prices breaching the +1 SD of the Bollinger band (20-day simple) and falling right after that with a declining slope of ATR.
Currently, the gold spot is hovering around the +1 SD of the Bollinger band, and is retracing the breakout level. The upper line of the channel or the level of USD 1,759.14 should act as the primary support for prices, followed by the bottom line of the channel.
The 12,24,9 MACD indicator is giving a positive signal, and it should be noticed that though gold prices are testing the breakout, major sentiments around the commodity remains bullish in nature.
Silver on Charts
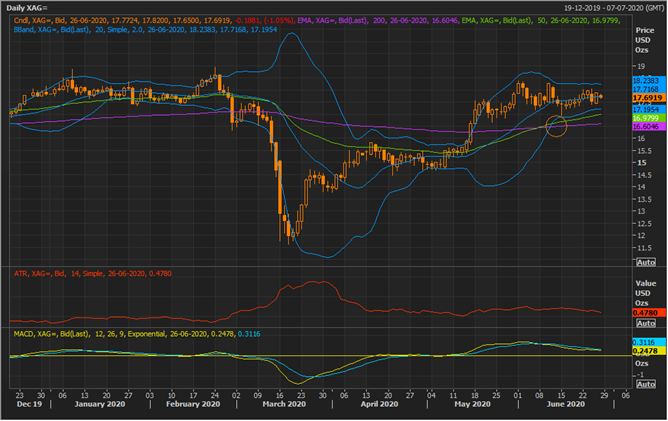
Silver Spot Daily Chart (Source: EODHD/Others Eikon Thomson Reuters)
On following the daily chart of the silver spot, it could be seen that at present prices are hovering around the mean value of the 20-day simple Bollinger band; however, it has shown a golden crossover between the 50-day exponential moving average and the 200-day EMA, suggesting that the major or the primary trend is an uptrend.
Furthermore, the commodity has recently tested the +1 SD of the Bollinger band but failed to give any volatility breakout. Post breaking a symmetrical triangle formation, silver spot rose steadily and is now near the previously mentioned resistance level of USD 18.72.
To Know More, Do Read: Silver Outperforms Gold with Over 30% Return; Money Managers Betting on Silver!!
It should also be noticed that the distance between the +1 SD and -1 SD is narrowing down, which technicians usually call Bollinger squeeze, while there is a golden crossover. However, though the MACD indicator is also giving a positive reading it has started sloping downside along with the ATR, increasing the probability of a correction.
The future movement of silver would depend upon its ability of breach and sustain above the resistance zone of USD 18.700 to USD 18.750 per ounce.
In a nutshell, the gold-to-silver ratio is now trading near its medium-term resistance level, while gold is retracing back its channel breakout and silver reaching near its resistance.
On comparing the daily chart and indication from both charts, technically, chartists would expect gold to once again outperform silver ahead; however, these are some unprecedented time, and at present base metals such as copper, nickel, zinc, lead have shown a decent recovery rally, which also points out that sentiments around industrial metals, which silver is a major part, are bullish in nature, and it would be worth looking ahead, as to which of the two precious metals would emerge victorious in terms of better returns, amidst neck-to-neck competition.
