
.jpg)


Crude oil price rally has stalled with prices of Brent crude oil futures trading in a range of USD 55.00 to USD 57.50 per barrel.
The surge in prices witnessed over the past couple of weeks could be primarily linked to the production cut as announced by major oil producers in line with their commitments. The demand side has also been recovering as global economies slowly come back to life, at least as compared to the situation a year ago.
However, while the demand for oil is slightly improving, the restricted supply chain has been one of the major price triggers for oil prices.
In the past couple of months, OPEC had slightly increased its oil output, which as per a survey from Reuters stood at 25.75 million barrels per day in January 2021, up by 160,000 barrels per day against the previous month. In line with the decision of the oil cartel to gradually ease the supply chain.
Likewise, Russia has also witnessed a slight increase in the same month in line with the OPEC agreement.
Let us look at the technical chart and decipher how the crude oil market has backed in the news and positioned.
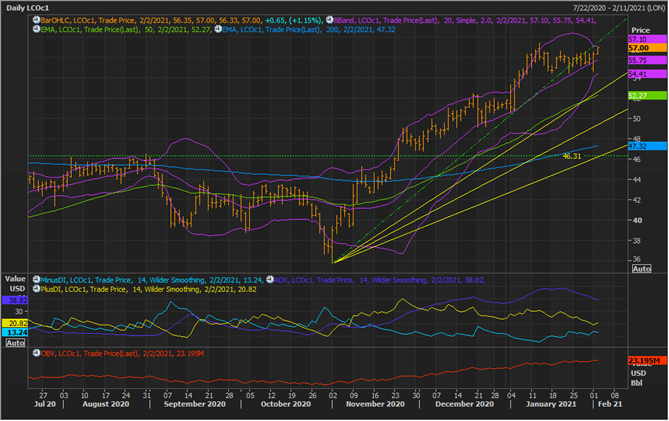
Brent Futures Daily Price Chart (Image Source: EODHD/Others Eikon Thomson Reuters)
On following the daily chart, it could be seen that crude oil prices have been trading in an uptrend for a while with prices trading above the 200- and 50-day exponential moving average.
- However, over the past few slower trading sessions, the commodity has now breached the short-term upward sloping supporting line (green trendline), which might now act as an immediate hurdle for the bulls.
- Additionally, the same line is overlapping with the +2 Standard Deviation of the 20-day simple Bollinger Band®; thus, could be decisive in nature, and a break and price action above the same could further propel bullish sentiments.
- On the flip side, the Fibonacci fan extended from the recent low to the recent high is showing primary support for the commodity. As visible in the above-presented chart, the 1/3 fraction of the Fibonacci fan is overlapping with the -2 Standard Deviation of the 20-day simple Bollinger Band®; thus, could be predictive in nature, and a break and price action below the same could seed bearish sentiments ahead.
- The major support for the commodity is at USD 46.31 or at the horizontal support line which is overlapping with the 200-day EMA.
On applying technical indicators, it could be seen that both OBV and ADX are moving in tandem with the price action. However, OBV has not reacted much to the recent correction in crude oil prices, suggesting that the downside movement has not been supported by large volumes.
