
.jpg)


The market oracle, Warren Buffet is now jumping on the oil bandwagon with Berkshire Hathaway investing in Chevron Corporation (NYSE:CVX). The investment by Berkshire Hathaway in Chevron, which started from third quarter last year, has now reached ~ USD 4.1 billion (as per Reuters).
The timing of the investment by the Omaha legend seems to be boding well with the current surge in crude oil prices, which is keeping many global oil companies buoyant in the market, including Chevron.
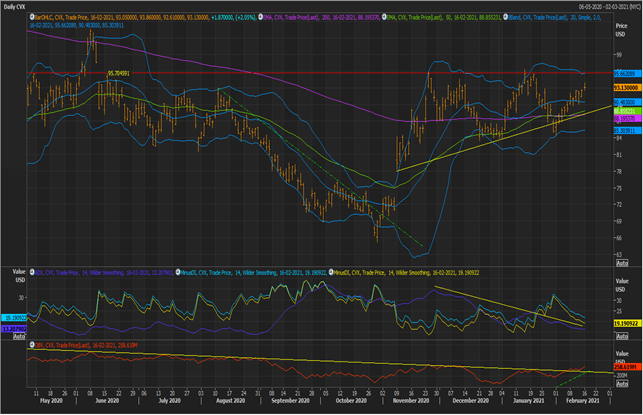
Chevron Oil Daily Price Chart (Image Source: EODHD/Others Eikon Thomson Reuters)
On following the daily chart, it could be seen that the stock of the Company has now changed the underline trend with prices moving above 200- and 50-day exponential moving averages. Meanwhile, the stock is also showing an ascending triangle formation.
- Chevron recently broke above the downward sloping trendline, and post sustaining the same, witnessed a large gap-up, leading to a rally, which halted around the horizontal resistance line at around USD 95.70.
- On applying the 20-day simple Bollinger Band®, it could be seen that the upper range and the lower range of the band, i.e., +/- 2 Standard Deviation is overlapping well with the horizontal resistance line (red line) and the upward sloping short-term trendline of ascending triangle.
- The major resistance for the stock is at USD 95.70 and could be decisive ahead, i.e., a break and price action above the same could seed bullish sentiments.
- On applying and analysing some technical indicators on the daily chart, it could be seen that volume indicator, i.e., OBV is moving in tandem with the price action with a slight divergence forming at the end, reflecting a large volume action.
- However, on the other side the ADX is showing a negative divergence with the price action. If the same persists, bulls can find it more challenging to break above the horizontal resistance line, increasing a possibility of a correction.
Meanwhile, crude oil prices are continuing with a strong recovery with the commodity price trading upward. Additionally, the recent trading sessions in the commodity has been largely towards the +2 Standard Deviation of the 20-day simple Bollinger Band®, leading to an up slope in ADX.
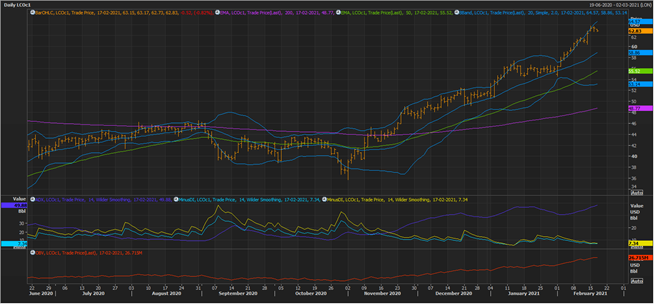
Crude Oil Daily Price Chart (Image Source: EODHD/Others Eikon Thomson Reuters)
At present, the major resistance for the commodity is at +2 Standard Deviation while the major support for the commodity is at the 50-day EMA, which is overlapping with the -2 Standard Deviation of the Bollinger Band®; thus, could be decisive ahead.
The OBV is moving in tandem with the price action, reflecting a large participation in the crude oil rally.
