


In order to enhance their profits, investors need to invest in those companies who are making strong operational progress and are producing robust financial results. The below-mentioned companies are major players of their respective industries. Let us know more about the operational and financial positions of these companies.
Cromwell Property Group (ASX:CMW)
Real estate investor and manager, Cromwell Property Group (ASX: CMW) maintains a strong and secure balance sheet and long-dated Australian property portfolio which enables it to recycle assets and reinvest into its property investment and funds management businesses.
CMW FY19 Results: In the financial year 2019, this property group witnessed a 11.1% uplift in its operating profit. At the end of FY19, the group had Total assets under management (AUM) of $11.9 billion. For FY19, Cromwellâs direct property investment segment reported operating profit of $136.1 million, a 12.8% increase on the prior year. At the end of FY19, the company had 3,800 tenant customers in 15 countries, leasing over 3.7 million sqm of space. Funds and asset management segment operating profit was $28.5 million in FY19.
The distributions for the year amounted to $157.5 million, a slight increase on the previous year ($157.1 million). However, the distributions per security decreased to 7.25 cents in FY19, representing a payout ratio of 90%.
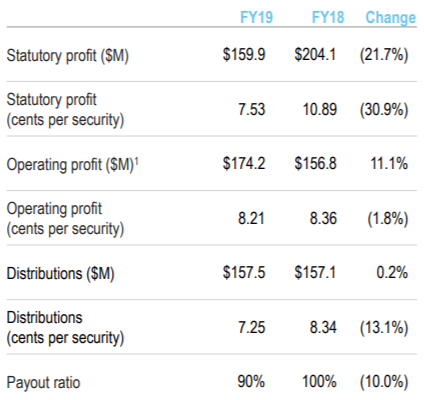
FY19 Results (Source: Company Reports)
The companyâs FY20 operating profit is affirmed at the upper end of previous guidance at 8.30 cps and distributions to at 7.50 cps.
CMW Stock Performance
On the stock Performance front, CMWâs stock has posted impressive results over last six months. The stock has provided a return of 12.22% in the past six months and 4.64% in the last three months. On year to date basis, the stock has gained 25.89%. CMWâs stock has 52 weeks high price of $1.270 and 52 weeks low price of $0.980 with an average volume of 7,097,677. At market close on 29 August 2019, CMWâs stock was trading at a price of $1.220 with market capitalisation of circa $3.22 billion. It is worth noting that CMWâs stock is trading near to its 52 weeks high price.
Crown Resorts Limited (ASX:CWN)
Australiaâs leading entertainment group, Crown Resorts Limited (ASX: CWN) currently operates two of Australiaâs leading integrated resorts, Crown Melbourne Entertainment Complex and Crown Perth Entertainment Complex
CWN Financial Performance
During FY19, the total normalised revenue across Crownâs Australian resorts reduced by 5.4% as compared to last year impacted by the reduction in VIP program play revenue in Australia, which was down 26.1%. The main floor gaming revenue was $1,689.3 million in FY19, up 0.5% on pcp. The Normalised EBITDA from Crown Melbourne was $589.5 million in FY19, down 8.6% on the previous corresponding period.
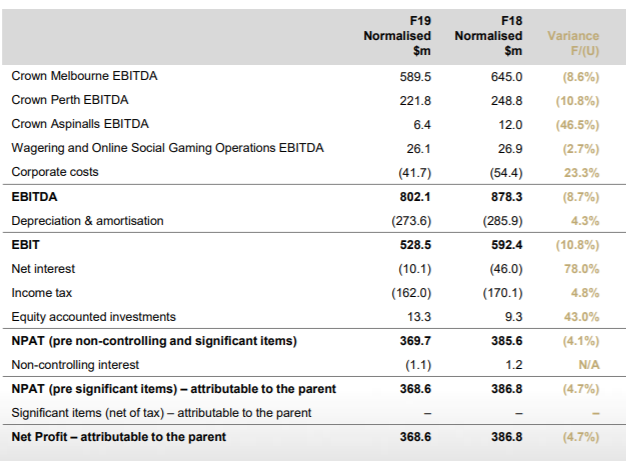
Crown Resorts Limited Group Result (Source: Company reports)
During the year, the company bought back approximately $131.4 million of share under the on-market share buy-back. This on-market share buy-back was expired today on 29 August 2019.
The company has announced a final dividend of 30 cents per share, taking the total full year dividend to 60 cents per share.
In May 2019, CPH Crown Holdings Pty Limited, entered into an agreement to sell 19.99 per cent of the issued capital of Crown to Melco Resorts & Entertainment Limited. CPH Crown Holdings Pty Limited and Melco Resorts have now agreed to amend the Share Sale Agreement, as announced on 29 August 2019.
CWN Stock Performance
On the stock Performance front, CWN stock has provided a return of 6.20% in the past six months CMNâs stock has 52 weeks high price of $14.420 and 52 weeks low price of $11.010 with an average volume of 1,847,504. CWNâs stock is trading at a PE multiple of 20.6x with an annual dividend yield of 4.93%.
At market close on 29 August 2019, CWNâs stock was trading at a price of $11.950 with market capitalization of circa $8.24 billion.
Woolworths Group Limited (ASX:WOW)
Australiaâs leading retailer, Woolworths Group Limited (ASX:WOW) has unveiled its FY19 results today. For FY19, the company reported total sales of $59,984 million (continuing operations), up by 5.3% on previous corresponding period (pcp). The companyâs EBIT (continuing operations) improved by 6.9% to $2,724 million. Group Online sales increased by 34.5% (31.6% normalised) in FY19, driven by strong growth from WooliesX, CountdownX and BIG W. the Statutory NPAT attributable to equity holders of the parent entity increased by 56.1% in FY19.
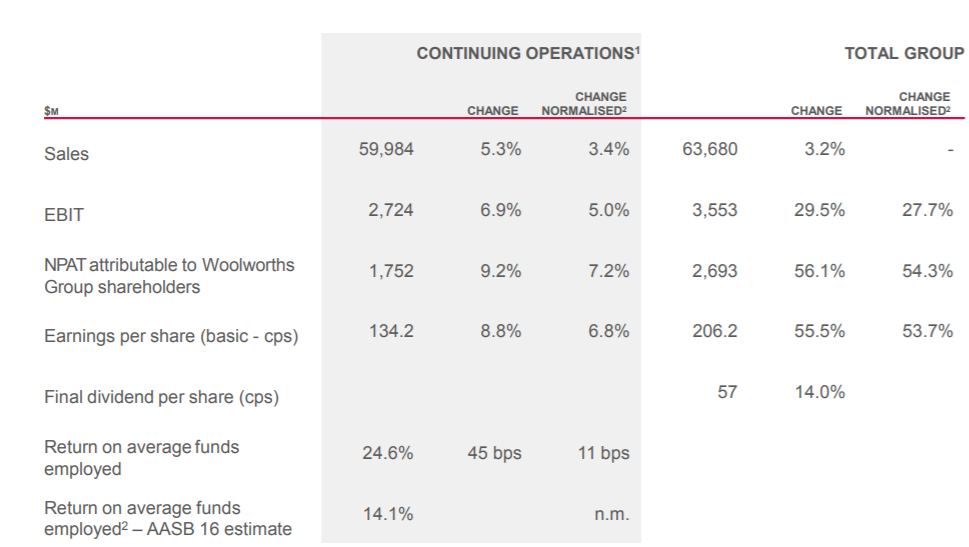
Key financial metrics of FY19 (Source: Company Reports)
In FY19, the companyâs cash flow from operating activities before interest and tax was $3,858 million, an increase of 0.5% on the prior year. Recently in May 2019, the company completed $1.7 billion off-market share buy-back.
WOW Stock Performance
On the stock Performance front, WOW stock has provided a return of 26.19% in the past six months. WOWâs stock has 52 weeks high price of $36.650 and 52 weeks low price of $27.030 with an average volume of 2,713,005. WOWâs stock is trading at a PE multiple of 27.320x with an annual dividend yield of 2.63%.
At market close on 29 August 2019, WOWâs stock was trading at a price of $36.380 with market capitalisation of circa $45.54 billion.
Macquarie Group Limited (ASX:MQG)
Australiaâs leading financial services company, Macquarie Group Limited (ASX: MQG) has now completed its $A1.0 billion institutional placement which will result in the issue of approximately 8.3 million new, fully paid ordinary shares (New Shares) at a price of $A120.00 per New Share.
The offer price of $A120.00 is representing:
- 2.8% discount to the last closing price 27 August 2019 i.e., $A123.51 and
- 2.8% discount to the 5-day VWAP1 of $A123.46
MQG Share Purchase Plan
The company will now undertake a Share Purchase Plan (SPP) with a maximum application size of $A15,000 per Eligible Shareholder. It is expected that the SPP offer will open on Wednesday, 4 September 2019 and close at 5:00 pm (AEST) on Friday, 20 September 2019.
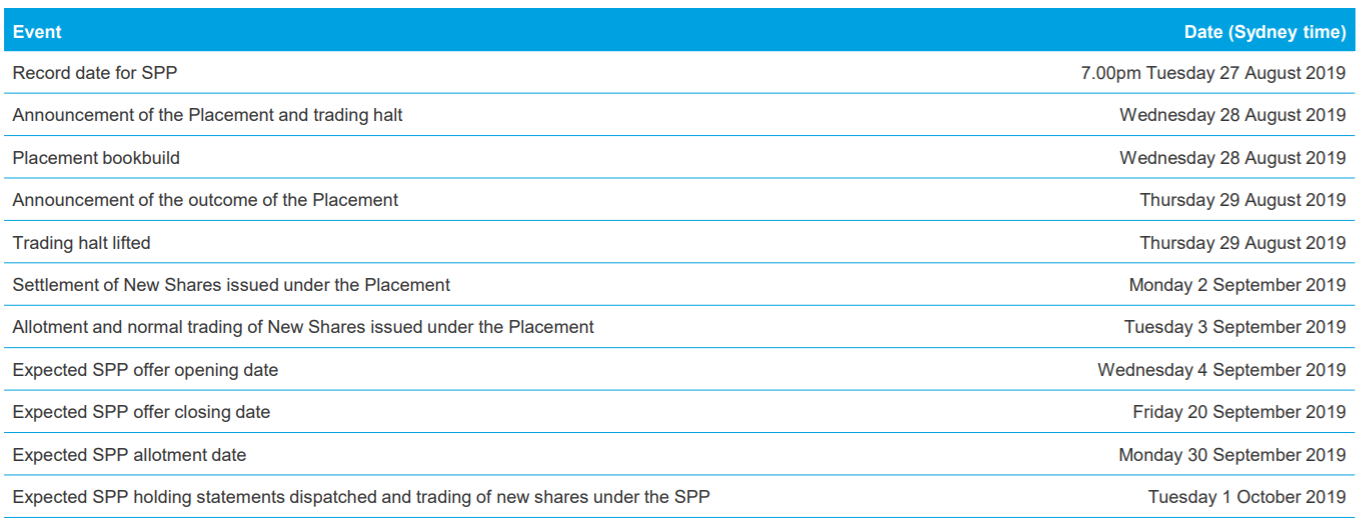
MQG Share Purchase Plan Offer Timetable (Source: Company Reports)
FY2020 Outlook: The company expects its result for FY2020 to be slightly down, as compared to FY19. The first half results of FY2020 are expected to be up approximately 10% on the 1H19 result however over medium term, the company is well positioned to deliver superior performance.
In FY19, the company earned operating income of $12,754 million, up 17 per cent on FY18. For FY19, the company declared an ordinary dividend of $5.75 per share (45% franked), representing a payout ratio of 66%.
MQG Stock Performance
On the stock Performance front, MQGâs stock has provided a negative return of 3.17% in the past six months. MQGâs stock has 52 weeks high price of $132.840 and 52 weeks low price of $103.30 with an average volume of 922,086. MQGâs stock is trading at a PE multiple of 13.98x with an annual dividend yield of 4.66%.
At market close on 29 August 2019, MQGâs stock was trading at a price of $122.530 with market capitalisation of circa $42.04 billion.
Disclaimer This website is a service of Kalkine Media Pty. Ltd. A.C.N. 629 651 672. The website has been prepared for informational purposes only and is not intended to be used as a complete source of information on any particular company. Kalkine Media does not in any way endorse or recommend individuals, products or services that may be discussed on this site. Our publications are NOT a solicitation or recommendation to buy, sell or hold. We are neither licensed nor qualified to provide investment advice.
