

_06_16_2026_04_54_27_535266.jpg)


Amidst ongoing global trade war concerns, slowed growth and low interest rate regime, some investors find it safer enough to invest in blue-chips i.e. stocks of those companies that have the potential to garner profits even during economic slowdown. These less-risky and less-volatile stocks tend to have stable growth rate. BHP Group Limited (ASX:BHP) and Afterpay Touch Group Limited (ASX:APT) are two eminent companies in Resources and Fintech sectors, respectively. BHP groupâs share is trading between its 52 weeks high and low levels of $42.330 and $29.062, respectively, whereas APTâs share is trading close to its 52 weeks high level of $31.460.
Let us have a look at the recent updates of these companies along with their stock information.
BHP Group Limited
BHP Group Limited (ASX:BHP) is involved in the exploration, development and production of oil and gas , mining of copper, silver, lead, zinc, molybdenum, uranium, iron ore and gold, and mining of metallurgical coal and energy coal. The company recently announced change in the directorâs interest, where Susan Kilsby acquired 2,900 ordinary shares in BHP Group Plc at GBP 17.13 per share, effective from August 23, 2019.
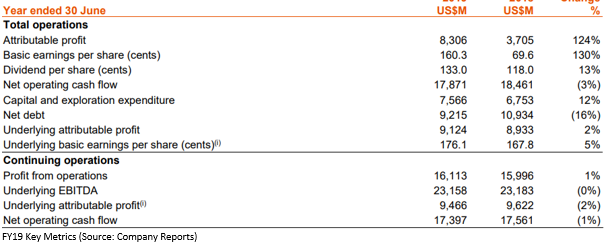
FY19 key Highlights: Revenue from continuing operations increased by 3% to US$44,288 Mn, whereas revenue from discontinued operations decreased by 61% to US$851 Mn, taking the total revenue for financial year 2019 at US$45,139 Mn. Profit after taxation from continuing operations attributable to the members of the BHP Group for the period was reported at US$8,648 Mn, which is an increase of 30% on previous year. Loss after taxation from discontinued operations attributable to the members of the BHP Group increased by 88% to negative of US$342 Mn, taking the profit after taxation attributable to the members of the BHP Group to US$8,306 Mn, which is an increase of 124% on previous year. Underlying attributable profit for the period increased by 2% to US$9.1 Bn. Net tangible assets per fully paid share on June 30, 2019 stood at US$10.11, as compared to US$11.25 in the previous year. Net operating cash flow for the period was reported at US$17.4 Bn, whereas free cash flow from continuing operation was reported at US$10.0 Bn. The net debt at the end of the period decreased by US$1.7 Bn to US$9.2 Bn, which reflects continued strong free cash flow.
The Board of Directors declared (fully franked) final dividend for current period at US 78 cents per share, as compared to US 63 cents per share in the previous corresponding period. The final dividend included an additional amount of US 25 cents per share above the 50% minimum payout policy. The company announced total dividends announced of US$1.33 per share (74% payout ratio). The record date and payment date are reported to be September 6, 2019 and September 25, 2019, respectively.
Capital and exploration expenditure were reported at US$7.6 billion, within the guidance. The company for now keeps its FY2020 guidance unchanged at below US$8 billion.
The Ruby (Trinidad and Tobago) oil and gas development was approved in August 2019, and with this the company had five major projects under development.
Stock performance: On September 2, BHP Group settled the dayâs trade at $36.580, up 0.799%, with the market cap of ~$106.9 Bn. Its current PE multiple is at 15.880x and its last EPS was noted at $2.286. Its annual dividend yield has been reported at 5.32%. Its 52 weeks high and 52 weeks low stand at $42.330 and $29.062, respectively, with an annual average volume of 6,334,715. It has generated an absolute return of 12.05% for the last one year, -3.54% for the last six months, and -3.74% for the last three months.
Afterpay Touch Group Limited
Afterpay Touch Group Limited (ASX:APT) is involved in providing technology driven payments solutions for consumers and businesses through its Afterpay and Pay Now services and businesses. The company recently published its FY19 annual report wherein it highlighted that its global underlying sales was reported at $5.2 billion, which is an increase of 140% on previous period, mainly due to growth outperformance across all geographies and channels. Active customers at the end of the period were reported at 4.6 million, an increase of 130% on previous year. Currently, the company is adding more than 12.5K new customers every day. Active merchants at the end of the period was reported at 32,300, which is an increase of 101% on previous year. As per the release, with major new merchant brands addition, the growth in the United States of America and the United Kingdom markets exceeded the expectations. Underlying sales in the United States of America was reported at ~$1 Bn in FY19 with run-rate in excess of $1.7 Bn. More than 2,00,000 UK customers added in the first 15 weeks, higher than the customers in the United States in the same time after-launch. New Zealand and Australian market continued to grow well, with robust instore growth with underlying sales more than $1 Bn since inception. Gross losses reduced from 1.5% in FY2018 to 1.1% in FY2019, mainly due to high purchasing frequency as well as high Afterpay customer Net Promoter Score, driving stable margin performance and customer lifetime value.
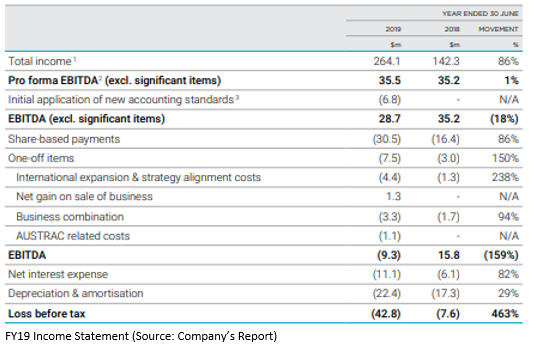
Total Afterpay pro forma income for the period increased by 115% to $251.6 on the previous period. Afterpay Net Transaction Margin for the period was reported at $126.1 million, which is an increase of 126% on previous period. Companyâs pro-forma EBITDA (Earnings before interest, tax, depreciation and amortization) (excluding significant items) was reported stable at $35.5 million. Statutory loss before tax for the period was reported at $43.8 million.
Underlying free cash flow for the period was reported at $33.3 million, which highlighted high ROCE (return on capital employed) business model and organically added growth capacity to the balance sheet. The company reported fully undrawn receivables finance facilities of $947 million with cash on hand at $230 million.
On September 2, APT settled the dayâs trade at $31.380, up 1.3%, with the market cap of ~$7.83 Bn. Its 52 weeks high and 52 weeks low stand at $31.460 and $10.360, respectively, with an annual average volume of 2,805,955. It has generated an absolute return of 71.92% for the last one year, 54.98% for the last six months, and 28.87% for the last three months.
Disclaimer
This website is a service of Kalkine Media Pty. Ltd. A.C.N. 629 651 672. The website has been prepared for informational purposes only and is not intended to be used as a complete source of information on any particular company. Kalkine Media does not in any way endorse or recommend individuals, products or services that may be discussed on this site. Our publications are NOT a solicitation or recommendation to buy, sell or hold. We are neither licensed nor qualified to provide investment advice.
