

Gold is among the hottest discussed commodities these days as it has earned quite a reputation for being volatile in the recent past. It is to be noted that, volatility is like a double-edged sword. Volatility is essential for traders to make money at the same time volatility wipes out trading corpus of lot of professional and amateur traders. In fact, beta is often used as a measure of risk by a section of investors/traders.
So how would an ideal investor or trader make the best of volatility to bring in some cash at the end of the day?
Albeit, the art is not well known to many people with limited subject knowledge, it is no rocket science either.
So, if you are among those people who are willing to invest but are hand tied, we would suggest you understand the art and science to make the most of it.
Well, of course, you are not alone in your endeavour, and we would try to analyse gold in great detail, which would surely help you in decision making. Likewise, time after time we would bring more detail and more assets under our purview, so till then Keep Reading, Keep Learning, and Keep Investing.
“Buy when there’s blood in the streets”- Baron Rothschild
Purview on Gold
The gold spot is on the rise from the level of USD 1,460.30 per ounce (intraday low on 20 March 2020) to the present level of USD 1,615.91 (as on 31 March 2020 4:55 PM AEDT), which underpinned a price appreciation of ~ 10.65 per cent.
Gold prices are now somewhat mimicking its historical rally of 2008 financial crisis, and many industry experts are quite optimistic over gold ahead.
To Know More, Do Read: Why is Gold a Consensus Buy and Why are Money Managers Buying It?
- Gold on a monthly chart
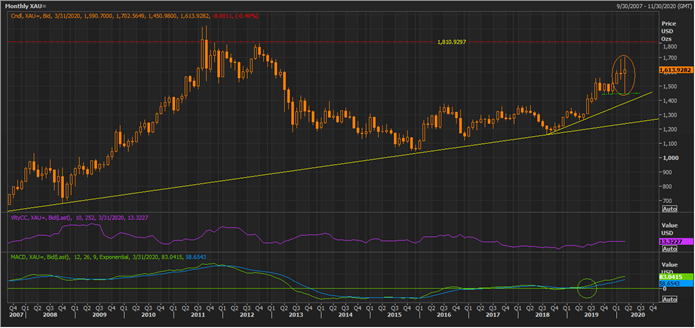
Gold Spot Monthly Chart (Source: Thomson Reuters)
On the monthly chart, the gold spot is currently trading in an uptrend, just above its immediate support around USD 1,480 per ounce. The long-term support is still intact with a positive signal from the moving average convergence divergence or MACD indicator.
The above chart shows the current support and resistance level and should be closely monitored by investors or traders. Despite all its positive charisma, gold price action and its volume are showing some disparity with the price reaching a new high, while the close-to-close volume indicator is unable to do so, which could signal towards an early sign of a reversal; however, till the time supports are intact on the chart, the probability of a change in technical signals remain high.
The MACD technical indicator, which is passing on a positive signal with a short-term average above long-term average is showing a narrow spread, which coupled with an early sell-off in gold (refer February and March candle), is supporting an assumption that early accumulators might be sheading off, while public interest grows in gold.
Post analysing the longer timeframe, it could be inferred that gold is currently in the second phase after the primary rally, which took it to a high of USD 1,920.80 in late 2011. As of now, the gold has established a low at USD 1,160.34 (in August 2018) but is yet to scale a new high.
If gold breaches the resistance level of USD 1,810 with good volume and sustains above that level, the chances are that it might be able to ink a new high and enter into the continuation of the primary rally again, otherwise, a break of every support could create a problem for gold enthusiasts.
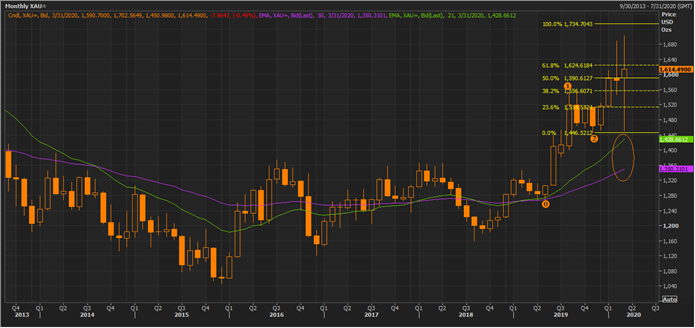
Gold Spot Monthly Chart (Source: Thomson Reuters)
On further analysing the chart it could be seen that moving averages are well confirming the current uptrend is gold with 21-day exponential moving average trading above the 50-day moving average with a large spread. However, the support presented here by the Fibonacci project could be crucial.
Till the time, the support level marked as (2) on the chart above is intact, the Fibonacci projections would hold; however, gold has already reached every suggested pivot point, except the 100.0 per cent projected level, which is now the immediate resistance for gold, and a break and sustenance above the same could raise further interest of the investing community in gold.
- Gold on a weekly chart
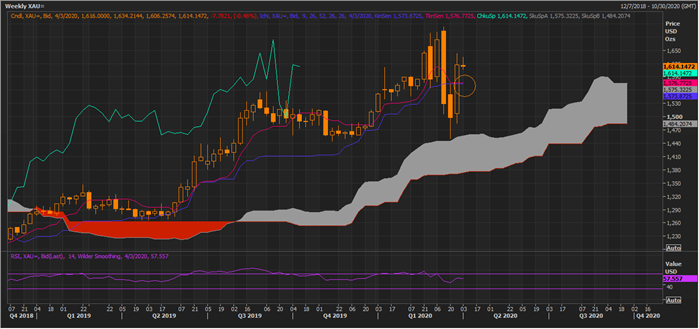
Gold Spot Weekly Chart (Source: Thomson Reuters)
On the weekly chart, the gold spot is placed above Span A, which is the mean value of the conversion line (pink) and the base line (navy blue), with a large spread between Span A and Span B, suggesting steam in an uptrend.
However, the smaller averages such as the conversion line (mean value of 9-week high and low) and the base line (mean value of 26-week high and low) are narrowing down, which coupled with a downward sloping RSI, could be inferred as an early sign of lost momentum, by the advocates of Ichimoku clouding technique.
As per the Ichimoku theory, the grey could area is where an asset finds its support and should be closely monitored by investors and medium-term swingers.
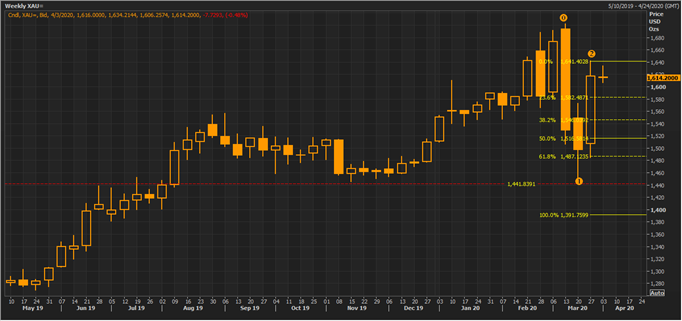
Gold Spot Weekly Chart (Source: Thomson Reuters)
The Fibonacci projections on the weekly time frame are also suggesting the same support level for gold around USD 1,440, as was suggested by the projections on the monthly chart.
- Gold on a daily chart
Gold Spot Daily Chart (Source: Thomson Reuters)
Now the daily chart is what should draw the attention of an astute investor, as the chart lack a clear cut trend with large fluctuations; however, the support level suggested by this time frame is same as suggested by the above time frames, i.e., around USD 1,440 per ounce.
However, the short-term trendline of the up move, which has been breached once is where an astute technical analyst would watch closely, depending upon the price behaviour of the commodity or else, it would interest the analysts above its resistance zone, or if when the spot successfully establishes a new high above its recent top at USD 1,647.28 per ounce.
At last, preserve your chips, be patient, and remember, during large price volatility you should time your entry and exit with caution, as that would separate you from traders who want to be right on every single trade and desperately try to create certainty where it just doesn’t exist.