


Gold prices are on an upsurge amid global uncertainties and dollar plunge. The prices of gold spot rose significantly from the level of US$1266.35 (low in May 2019) to the present high of US$1438.99, which in turn, marked a gain of more than 13.50 per cent in approx. 50 days including non-trading days.
The upside in gold pulled the gold miners along with it as the gold miners on ASX enjoyed an up-rally.
Now, the gold prices are relatively higher, and investors are eyeing the opportunity to enter the market; however, to identify if the time is right to jump in the upsurge, let us now take a look over the charts of gold and gold miners on the Australian Securities Exchange.
Gold on Charts:
 XAU Monthly Chart (Source: Thomson Reuters)
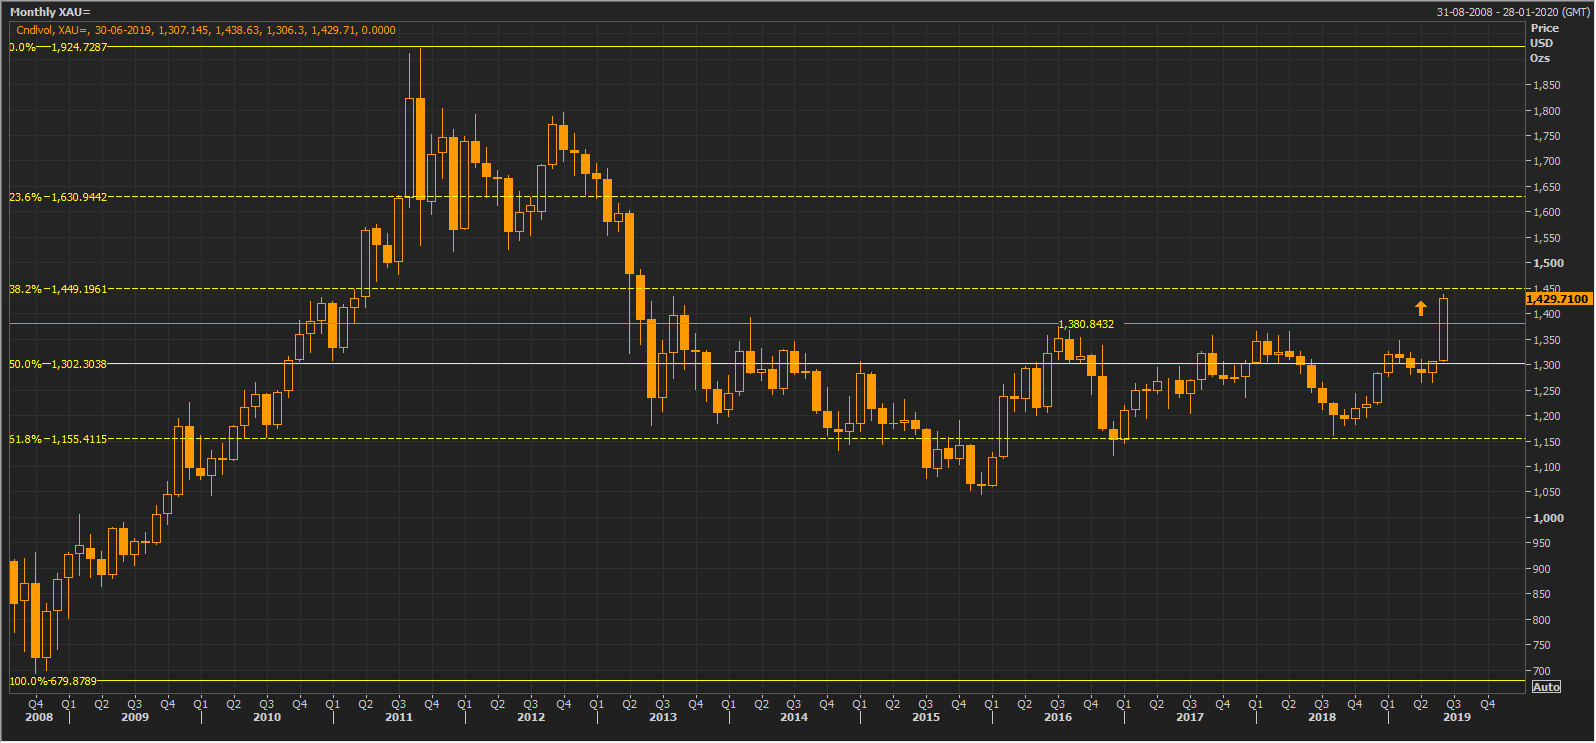
On a monthly chart, the gold prices took support around the 51.8 per cent level of the prior gold rally, which started from the level of approx. US$679.8789 and ended at the level of approx. US$1924.7287.
Post taking the support from that level the gold prices rose in the present month and breached the resistance on a monthly chart, which was at US$1380.8432. The breaching on the monthly chart suggests a breakout on gold on a monthly chart. Now, the ability to sustain above the level or a retracement below it again would decide the further price action of gold.
 XAU Daily Chart (Source: Thomson Reuters)
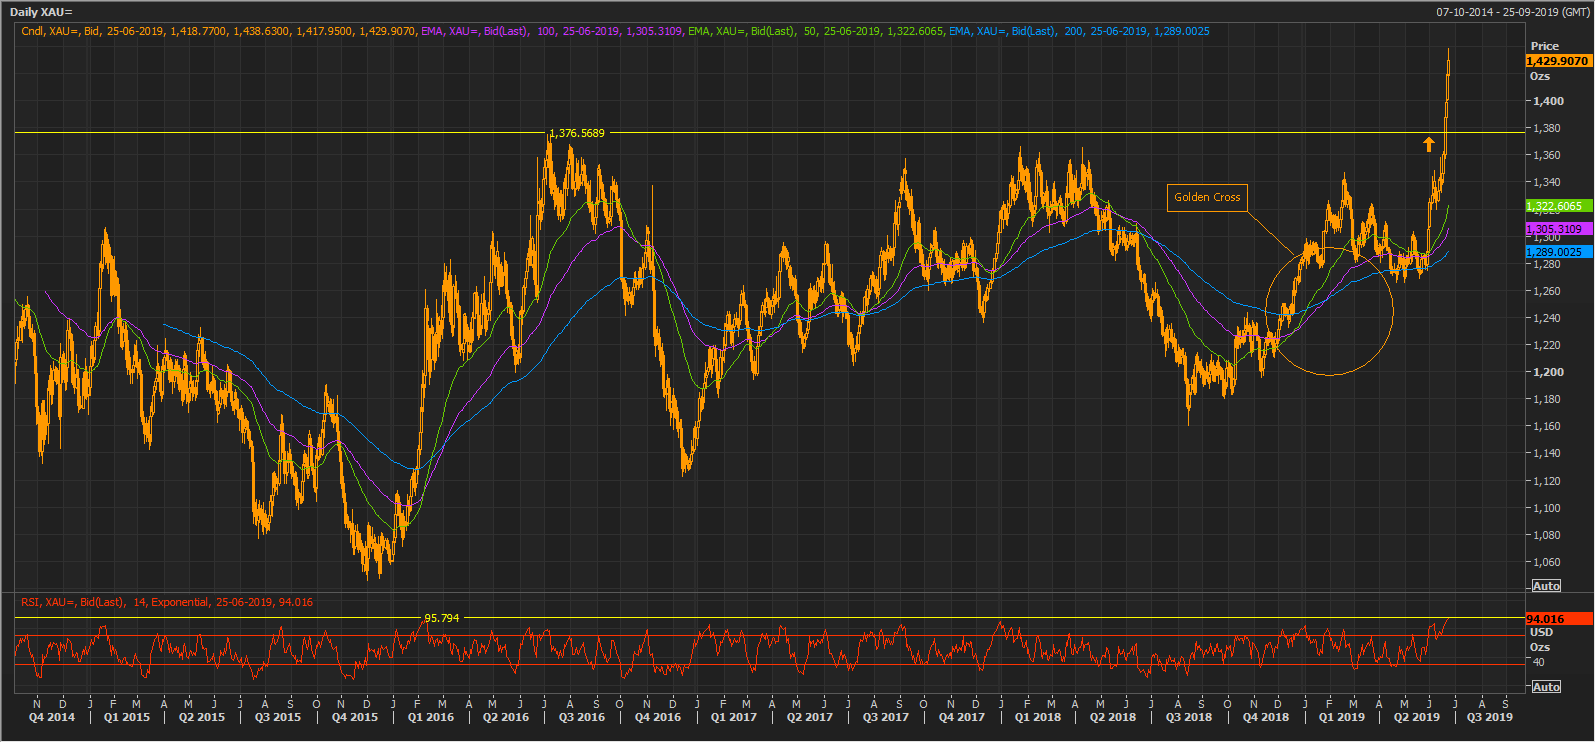
The monthly breakout is clearly visible on a daily chart as well. Apart from the breakout, the daily chart also shows that the gold prices are currently trading above the trio of 50,100,200-days exponential moving averages, which are presently at US$1322.6065, US$1305.3109, and USS$1289.0025 respectively. The moving averages pair is showing a Golden Cross (bullish signal) on a daily chart, which is marked with an orange circle on the chart shown above.
However, the Relative Strength Index of 14-days is currently moving towards the overbought zone and is at 94.016. The Relative Strength Index (14-days) is also moving towards its previous high level of 95.794. A break above or failure to do so would decide further actions in it.
 XAU Daily Chart (Source: Thomson Reuters)
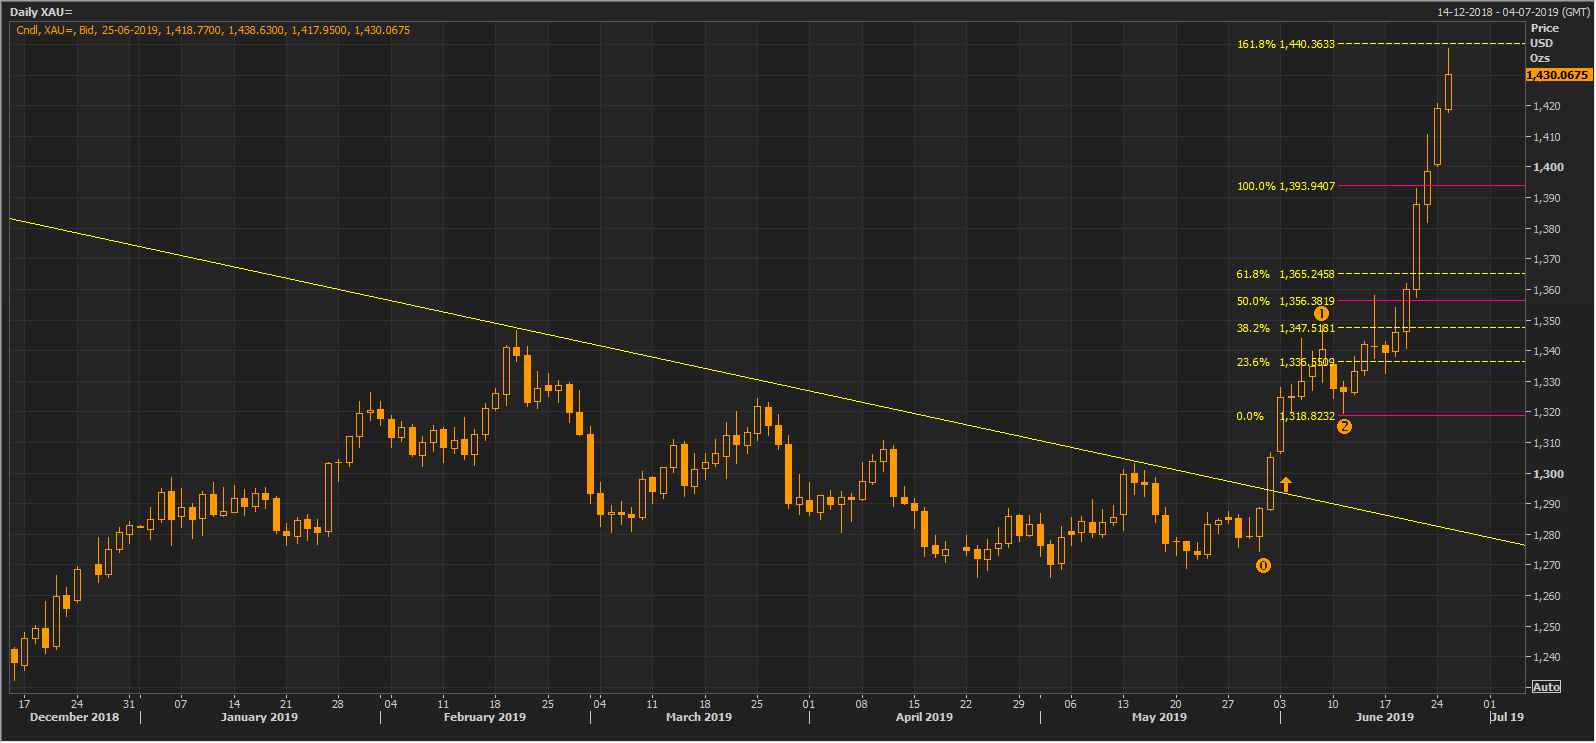
On a daily chart prior to breaking the monthly resistance level, the gold prices broke the resistance offered by the downward sloping trendline on the daily chart. The uprise, followed by a correction presented perfect points to connect the Fibonacci Series. The connection points of the series are marked with 0,1,2 on the chart shown above, and it can be seen that the gold prices are currently taking a hurdle of the 161.8 per cent projected level of the Fibonacci Series. A break above or failure to do so would decide further price action in it.
Gold and the Miners- SAR, SBM, RSG
 XAU, SAR, RSG, and SBM Daily Chart (Source: Thomson Reuters)
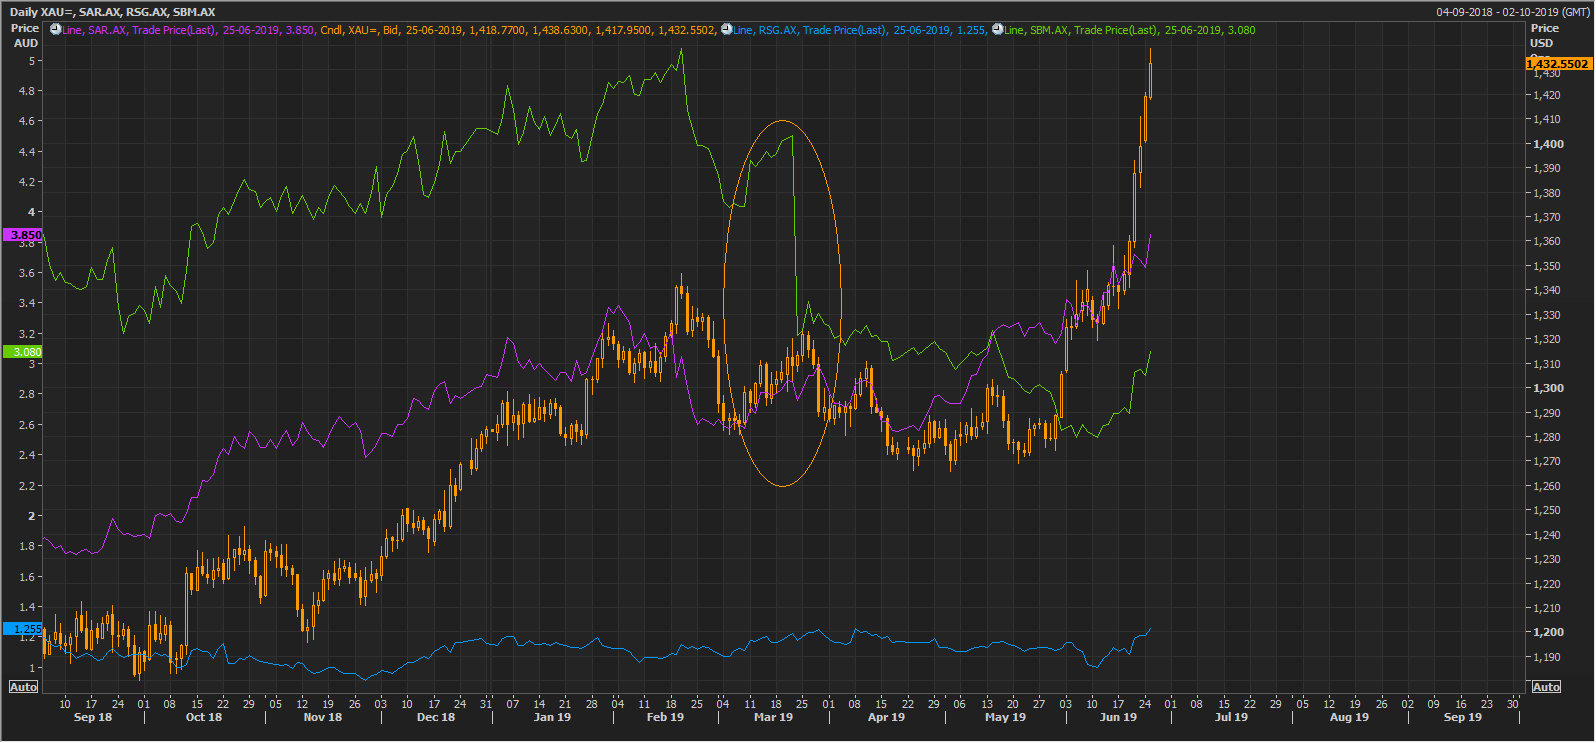
From the chart shown above, it can be seen that the gold miners in tandem with the gold movement, and in the chart shown above the miners are following the gold trend closely; however, the fundamentals and events on the company level at times create a diversion from the underlying benchmark.
The diversion was noticed in the charts when the gold miners dropped prior to a downfall in gold prices. The deviation is marked with an orange circle on the chart shown above.
Saracen Mineral Holdings Limited (ASX: SAR) on Charts:
 SAR Daily Chart (Source: Thomson Reuters)
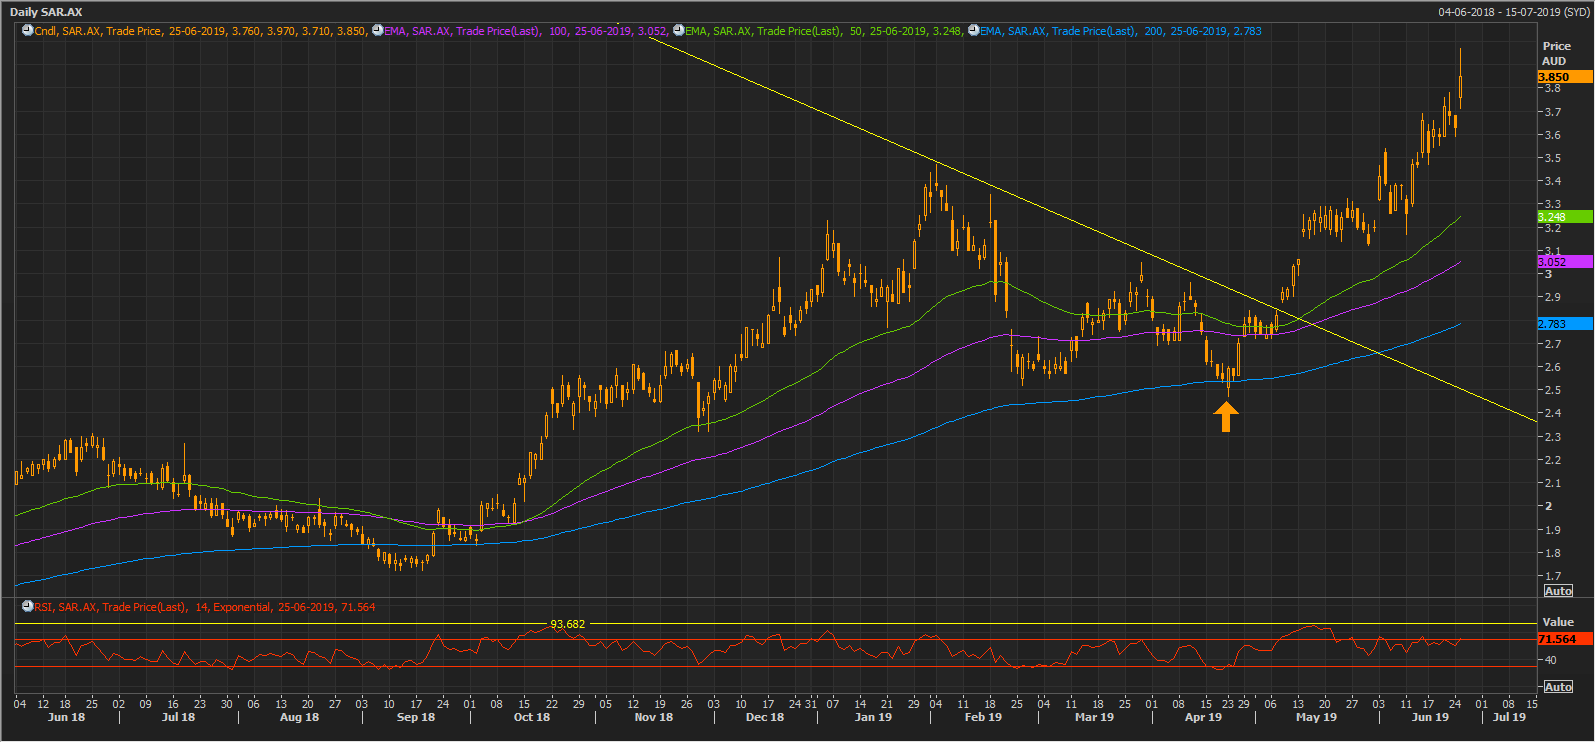
On a daily chart, the shares of the company breached the hurdle of the downward sloping trendline and rose significantly. Apart from a breakout, we can see that the share price of the company is trading above the 50,100, and 200-days exponential moving averages, which are currently at A$3.248, A$3.052, and A$2.783 respectively.
While attempting to break above the downward sloping trendline, the share price of the company plunged; however, the 200-days EMA provided the support to the falling prices (orange arrow), and the stock rose to breach the hurdle.
ST Barbara Limited (ASX: SBM) On Charts:
 SBM Daily Chart (Source: Thomson Reuters)
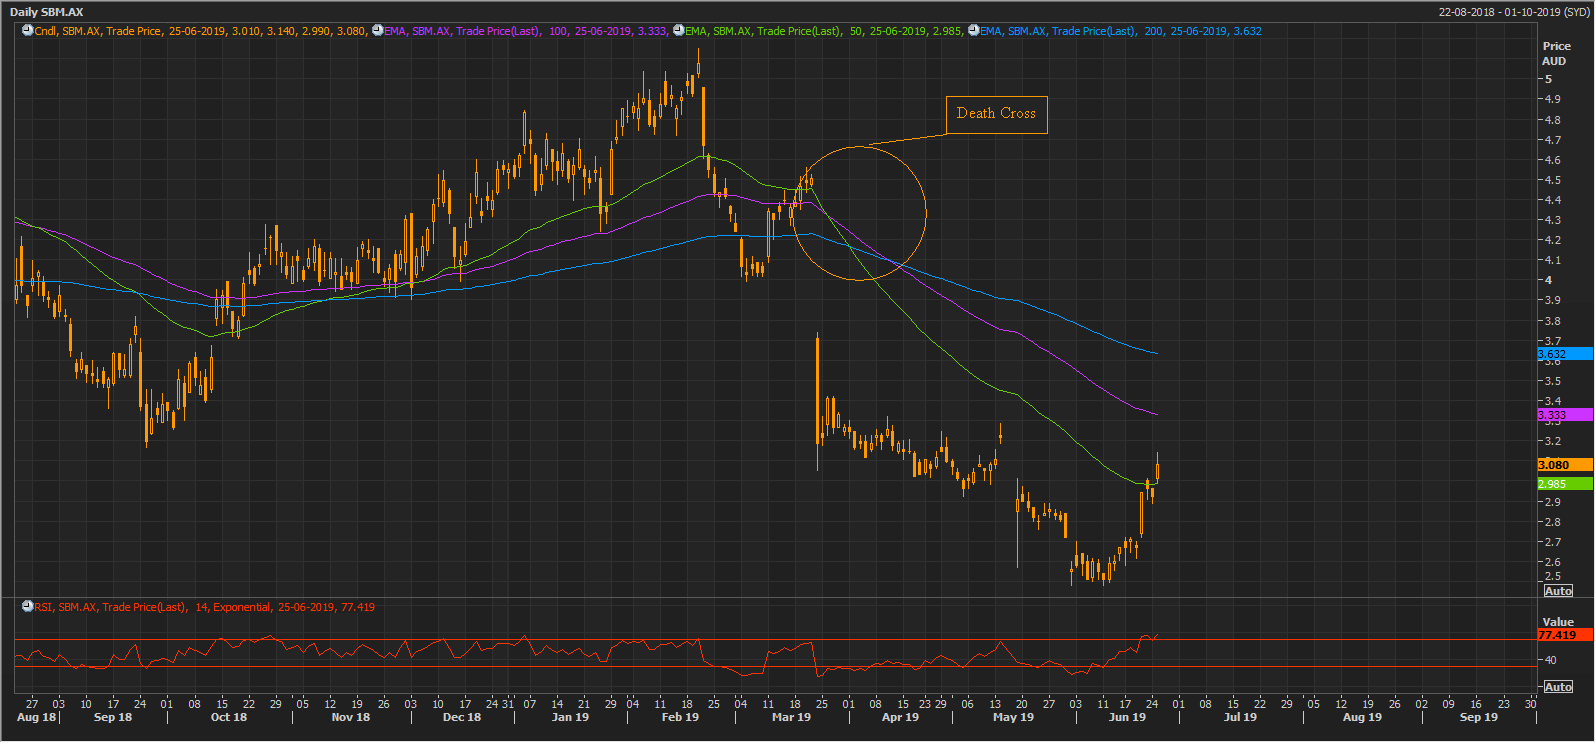
The share price of the company witnessed a Death Cross (bearish signal) on a daily chart and plunged significantly. The prices are currently above the 50-days exponential moving average, which is presently at A$2.985, and the same moving average is now acting as support to the share price of the company.
However, the prices are trading below the 200-days and 100-days exponential moving averages, which are presently at A$3.333 and A$3.632 respectively. The same averages could provide a hurdle to the share prices of the company. As stated above the 50-days EMA is providing support, and a break below or sustainig above the 50-days EMA would decide further price action in it.
Resolute Mining Limited (ASX: RSG) on Charts:
 RSG Daily Chart (Source: Thomson Reuters)
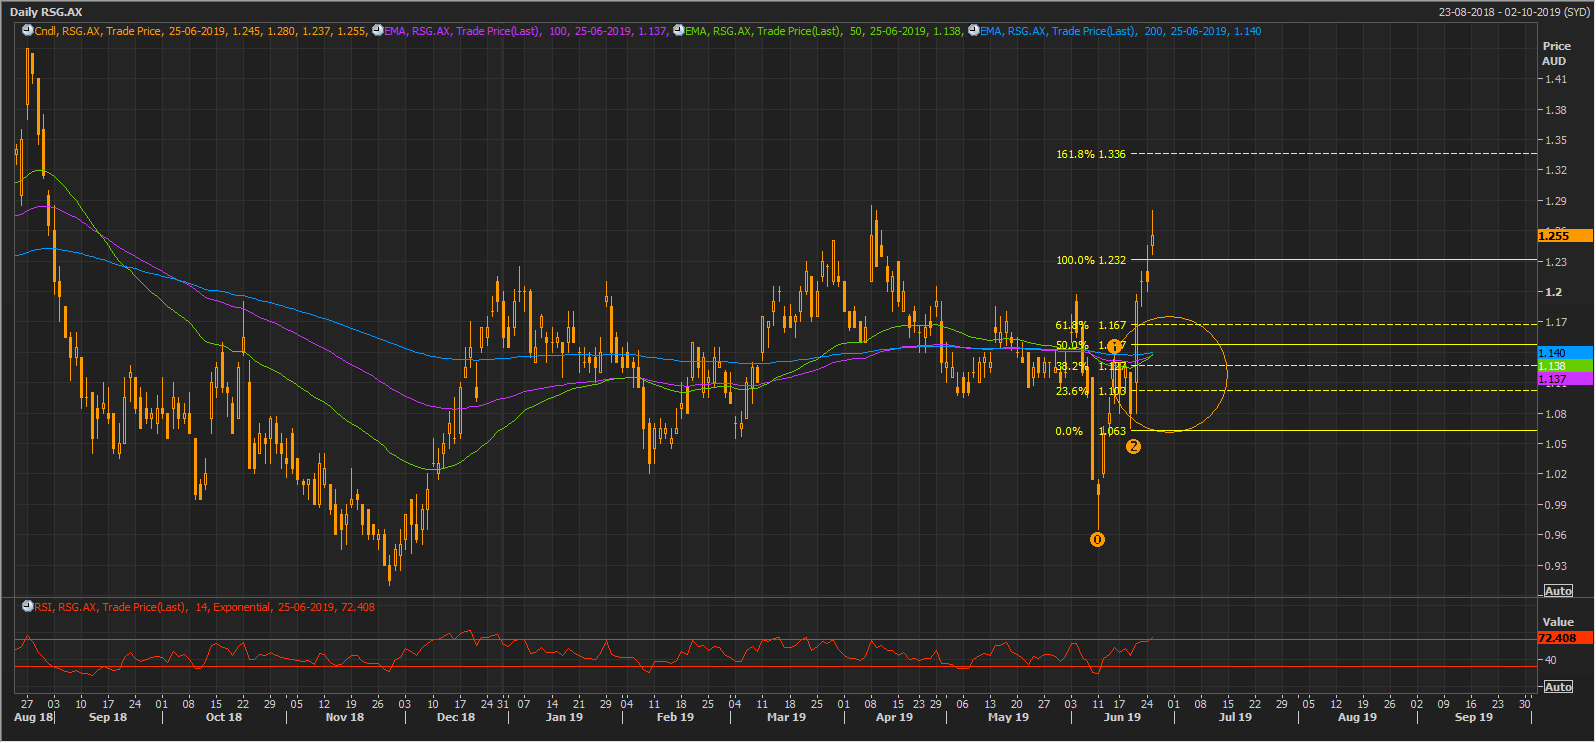
On a daily chart, the share price of the company is moving to form a Golden Cross (bullish signal) of 50, 100, and 200-days exponential moving average, which are currently at A$1.138, A$1.137, and A$1.140 respectively. The prices are currently trading above all the moving averages, and a continuation of the current price trend could further help the stocks to form the bullish signal.
However, the Fibonacci Series, produced by connecting the points 0,1,2 (on the chart above) is projecting the level of A$1.336 (161.8 per cent), which could offer resistance to the share price of the company. The shares have already crossed the 100.0 projected level of the Fibonacci, which is generally regarded as the most stringent level to breach if fewer bulls are backing the price.
The Relative Strength Index of 14-days period is currently at 72.408, which is above its mean of 50 and is presently moving towards the overbought zone.
Return Profile:
As we can see, on the charts shown above, the gold rush pulled the string on these miners and all the stocks under discussed are under a sharp up-rally.
 Comparative Returns Table (Source: Thomson Reuters)
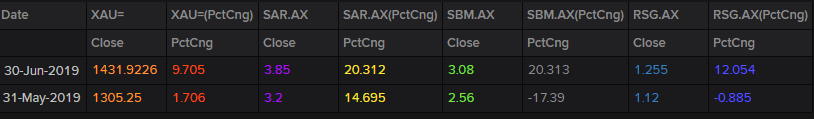
However, on the return profile, we can see that the share price of the St Barbara (ASX:SBM) have outperformed all the returns, when compared in percentage terms. As per the yesterdayâs closing price, the return from 31st May 2019 Closing price for SBM stands at 20.313 per cent, while return for SAR, RSG, and Gold are at 3.08 per cent, 12.054 per cent and 9.705 per cent respectively.
Disclaimer
This website is a service of Kalkine Media Pty. Ltd. A.C.N. 629 651 672. The website has been prepared for informational purposes only and is not intended to be used as a complete source of information on any particular company. Kalkine Media does not in any way endorse or recommend individuals, products or services that may be discussed on this site. Our publications are NOT a solicitation or recommendation to buy, sell or hold. We are neither licensed nor qualified to provide investment advice.
