


Gold prices jolted once again in the international market, with Gold spot (XAU) dropping from the level of $1324.57 (Dayâs high on 25th March 2019) to the present level of around $1305. The current fall in the gold prices marked the third day of a decline in its prices after its recent rally, which started from the level of 1280.93 (Dayâs low 7th March 2019) stalled at $1324.57 (Dayâs High on 25th March).
Dollar prices recovered sharply, with the dollar index (DXY) increased significantly from the level of 95.74 (Dayâs low on 20th March) to the current high of 97.05. The increase in the dollar prices was majorly attributed to the improving trade balance of the United States of America.
U.S. Trade Balance increased to -51.1B for February 2019 as compared to the market expectation of -57.2B. The trade balance is calculated on an equation which takes the difference between import and export.
Apart from the improving dollar prices, a slight rise in the U.S-10-year yield-to-maturity also exerted the pressure on gold prices. The bond yield or the market discount rate improved after hitting a dayâs low of 2.342% and rose to mark a high of 2.386%.
However, falling gold prices seem to not have not impacted Saracen Mineral Holdings Limited, a gold miner on the Australian Stock Exchange, which traded in the positive territory during the dayâs session.
Saracen Mineral Holdings Limited (ASX: SAR) rose to mark a dayâs high of A$3.050, before ending the day session at A$2.990 (as on 28th March), up by 2.40% as compared to its previous close.
The prices spiked after the opening of the day session on ASX and made the dayâs high before correcting to the level of A$2.970, which marked a 100% retracement from the dayâs high to the opening price of the stock.
Saracen on Charts:
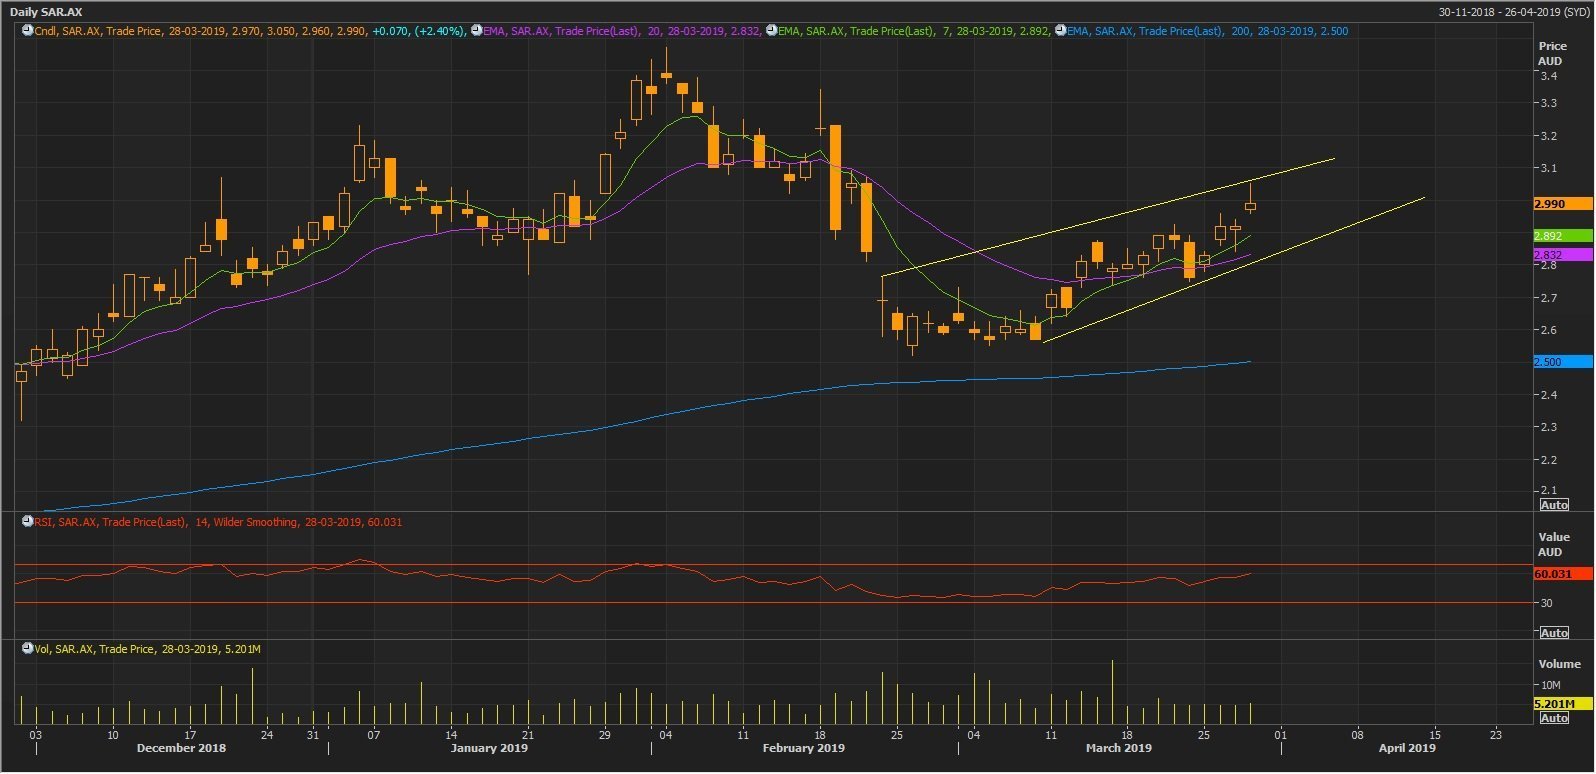 Source: Thomson Reuters: SAR Daily Chart
On following the development on a daily chart, it can be seen that the stock prices of the company are moving in an upward channel. Today, the stock price touched the upper ceiling of the channel line and took hurdle around the dayâs high of A$3.050. The stock prices are trading well above the 7-days exponential moving average (EMA), which is at A$2.892 and 20-days exponential moving average which is at 2.832. The prices closed with a significant margin above both the 7 and 2-days EMA. The short-term 7-day EMA has recently crossed the medium term 20-days EMA from below, which indicates a Golden-Crossover.
The Prices and both the short-term and medium-term EMA is above the longer-term 200-days EMA, which is at A$2.500. The Relative Strength Index (14-days) is at 60.031, which is well above its mean value of 50. Another interesting observation in the chart is the rising volume along with the increasing price.
Disclaimer
This website is a service of Kalkine Media Pty. Ltd. A.C.N. 629 651 672. The website has been prepared for informational purposes only and is not intended to be used as a complete source of information on any particular company. Kalkine Media does not in any way endorse or recommend individuals, products or services that may be discussed on this site. Our publications are NOT a solicitation or recommendation to buy, sell or hold. We are neither licensed nor qualified to provide investment advice.
