


The domestic gross domestic product (or GDP) expanded by 0.5 per cent during the last quarter of the year 2019 on a seasonally-adjusted basis, as reported by the Australia Bureau of Statistics on March 04, 2020. However, while the last quarter witnessed an above market consensus growth, the full-year growth of the country, which remained at 1.8 per cent, reflected the weakest reading in the country’s 28-year run without a recession.
The weaker economy further led towards a depreciating currency with AUD toppling ~ 13.70 per cent from its 2018 high of 0.8136 per USD to the end of the year. The story of depreciating home currency did not stop there, and the currency further took a toll from the rise in the United States dollar prices amid the coronavirus outbreak.
AUD depreciated further from the onset of 2020 to reach a low of 0.5507 per USD (as on March 19, 2020) as business across the continent took a hit from the COVID-19 spread, which caused more damage than the recent bushfires.
However, in the status quo, some number and economic data are now working in favour of the domestic currency, but many market participants see the recovery in the domestic currency as a slight bounce of a long going downtrend.
To Know More, Do Read: GDP- Lowest In 28 Years of No Recession Leads Home Currency Below A Decade Low; What’s Next?
Economic Data and Actions Working in Favour of the Home Currency?
- The Monetary Policy-March 2020
In an extraordinary monetary policy meeting held by the Reserve Bank of Australia on March 19, 2020. RBA decided to cut the cash rate from 0.50 per cent to 0.25 per cent, which marked a fresh all-time low. In an ideal case, such quantitative ease should ideally bring more liquidity into the picture and bring the price of currency lower, but as these are hard times, the higher liquidity offered by RBA decision was most welcomed by the currency market; and,
- The higher liquidity in the wake of all-time low interest-rate was anticipated by many industry experts to support the business along with the fast-track lending announced by the RBA for companies through a three-year funding facility, especially to small- and medium-sized businesses, which would now be able to borrow the cash at the lowest of interest of 0.25 per cent.
Not just the action from RBA, the development at the counterpart, i.e., on the USD front also supported the home currency value. The recent fall in the global equity market led many market participants to seek a safe haven in the United States dollar, leading to a further crunch, which further prompted the United States Federal Reserve to slash the interest rate and ease lending, improve lines of credit, and many other such actions, which finally cooled-off the hoard for the United States dollar, and in turn, supported the cross-currency rate, including AUD.
To Know More, Do Read: Is FED Running Out of Bullets in Bringing Down The COVID-19 Impact? Oil Market Yet Under Duress
- Morrison Government Stimulus Package
On March 12, 2020, the Morrison Government unveiled a $17.6 billion stimulus package to shield the domestic economy from the impact of the COVID-19 outbreak. The package coupled with a previous rate cut by RBA of 0.50 bps on March 3, 2020, aimed to boost the household spending via one-off cash payments, wage subsidies, and help the businesses engaged in export-related activities from China.
The packaged pumped-in $11 billion into the economy for the second quarter of the year 2020, while keeping $750 million aside for one-off cash payment from the end of the first quarter, totalling $4.8 billion.
Also, the package allocated $1.3 billion to subsidise apprentices’ wages to prevent job losses. The continent witnessed a rise in employment during February 2020 with an addition of 26,700 new jobs on a seasonally-adjusted basis, which reduced the unemployment by 5.1 per cent in February 2020, up by 0.2 per cent against the previous month.
The recently announced stimulus package, which also aims at job prevention is building high market anticipation of steady unemployment average rate, and Thomson Reuters assess the unemployment rate across the continent would average at of 5.2 per cent for 2020 and 2021, unchanged from its previous month estimates.
AUD on Charts
- AUD on a Daily Chart
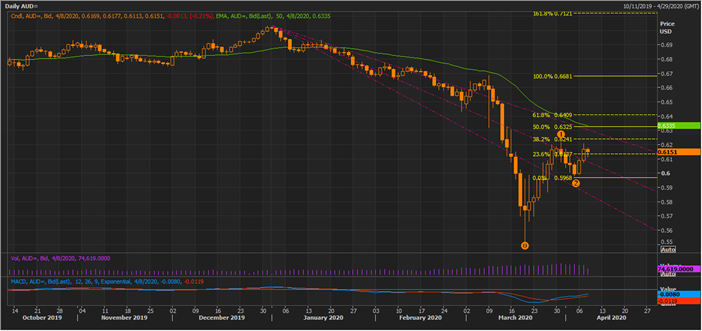
AUD on a Daily Chart (Source: Thomson Reuters)
On the daily chart, it could be seen that the currency successfully broke above the 2/3 fraction of the Fibonacci fan resistance projected by connecting the recent high with the recent low and is upholding the break with decent volume. The next resistance or 1/3 fraction of the Fibonacci resistance fan is still intact, and a break and close above the same with decent volume could serve as an early signal of a change in trend.
The moving average convergence and divergence or MACD indicator is giving a positive signal, and by extending Fibonacci projections from the wave points, marked as 0,1,2 on the chart, it could be noticed that the currency is now moving forward to test the 38.2 per cent projected level, above which, the Fibonacci theory suggests that the price test the 61.8 per cent projected level, and finally the 100.0 per cent projected level, which is considered as the point of high resistance and importance.
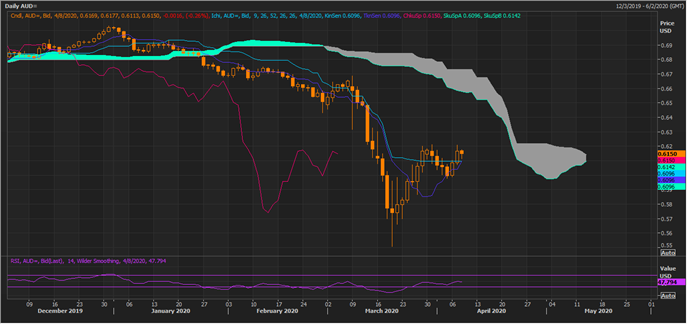
AUD on a Daily Chart (Source: Thomson Reuters)
On further applying the Ichimoku clouding technique on the daily timeframe, it could be seen that the currency is moving up to test the resistance zone or the grey zone, formed after Span A, which is the mean value of the conversion line (Dark Blue) and the base line (Sky Blue), slipped below Span B, which is the mean value of 52-day high and low.
Also, it should be noticed that the conversion line or the mean value of 9-day high and low, is nearing towards the base line (mean value of 26-day high and low), for a positive crossover, which is yet pending, and should be monitored ahead.
The narrowing spread between Span A and Span B coupled with an upward sloping 14-day relative strength index line is reflecting exhaustion in the downtrend.
