


Qantas Airways Limited (ASX:QAN)
Qantas Airways Limited (ASX: QAN) provides passenger and freight air transportation services in Australia and internationally. The company lately made an announcement related to its ongoing on-market buy-back event with a total consideration of up to $305 million. The remaining consideration to be paid for shares under the buy-back is up to $19,348,759.32. Till-date, the company has bought back 51,679,151 shares at a consideration of $2,85,651,240.68.
In another update, Qantas Airways Limited and American Airlines greeted the tentative approval from the US Department of Transportation for the joint business of the carriers, which will enable them to serve better to the customers flying between the United States and Australia and New Zealand.
The two carriers will merge commercially once the approval for the joint business is final, which will result in significant customer benefits and the addition of new routes.
Several opportunities can be derived from the integration of the business, including the opportunity to launch new routes, and flights to new destinations, where there are no services by either carrier currently. Optimised schedules on trans-Pacific services will create more opportunities with further connections to newer destinations and will reduce the total travel time and additionally, advantage from better accessibility to seats on the carrier network of the airlines will lead to lower fares.
Further benefits can be obtained from the integration programs, which will result in higher earn rates for points, allowing cross networking beyond the current capacity, enhanced redemption opportunities, and improved reciprocal end-to-end recognition of the top-tier frequent flyers.
Within the first two years of the proposed joint business, both carriers intend to launch several new routes. In parallel, Qantas is anticipated to announce the details of the two new routes Brisbane-Chicago and Brisbane-San Francisco, post receival of the final approval.
The application received tremendous public support. Consequently, additional jobs will be created in the industry, which will ultimately benefit the community as well, noted by the American Airlines Chairman and CEO, Doug Parker. The company is thankful to Secretary Chao and the DOT for considering the prospect of integration.
The Chief Executive Officer of Qantas, Alan Joyce, mentioned that the proposal submitted to the DOT from both the airlines is interesting and would bring significant benefits to millions of travellers along with a boost for tourism as well.
Both companies have been operating for more than 30 years to connect the US and Australia as a partner. The partnership will pave the way for better performance offering new routes, better flight connections along with higher frequency. The final decision from the DOT is pending and is expected to come in the next few weeks.
Turning to the financials, the underlying profit before tax for Qantas stood at $780 million and the statutory profit amounted to $735 million in 1H19. The revenue for Qantas International increased by almost 7 per cent to $3.7 billion, but EBIT declined by 60 per cent to $90 million, primarily on the back of a rapid rise in fuel costs (up by $219 million for the half).
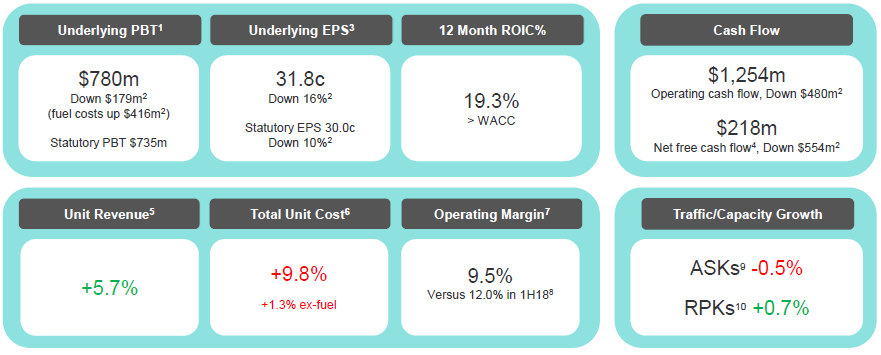
Key Financials 1HFY19 (Source: Company Reports)
The Qantas Group reported a strong underlying profit before tax of $780 million for the first half of 2019, which was 19 per cent lower than the prior corresponding period. The revenue was substantially offset by a $416 million increase in fuel costs along with the impact of foreign exchange on non-fuel costs and increased selling costs on higher revenue and depreciation.
The net passenger revenue increased by 6%. The higher fuel and other costs were neutralised by the increase in net passenger revenue. The increase in unit revenue, increased yields along with higher load factors and higher ancillary revenues in domestic and selected international markets helped the revenue growth of the company.
The effect of inflation, selling expenses, foreign exchange impact on non-fuel costs, and increased depreciation was offset by the benefits of transformation and other non-passenger related revenues. The targeted optimal capital structure for the company leads to the lowest cost of capital, which resulted in net debt in the ambit of $5.2 Bn and $6.5 Bn. The cost of capital of the group is minimised through the capital structure, enabling the company to keep the financial strength and ultimately enhance the long-term shareholder value. As per the current average invested capital, which is approximately $8.9 billion, the Net Debt/ROIC EBITDA is in the ambit of 2.0 to 2.5 times.
The net debt was $5.2 billion in 1H19, which was at the bottom end of the targeted range. The capital allocation decisions, including distribution to shareholders, is underpinned by the decision to ensure that the net debt remains within the targeted net debt range on a forward-looking basis. The optimal capital structure of the group is in alignment with the investment grade credit metrics, along with a rating of Baa2 by Moodyâs Investor Services.
The rolling 12 month Return on Invested Capital (ROIC) for Qantas was 19.3 per cent, which was above the groupâs threshold ROIC of 10 per cent. The current Average Invested Capital is approximately $8.9 billion. Qantas maintains an objective to grow invested capital and return any surplus capital back to shareholders with a disciplined capital allocation approach.
The stock of Qantas Airways Limited was trading at $5.640, an increase of 0.356% during the dayâs trade with a market capitalisation of $8.87 billion (on 14th June 2019, AEST 01:40 PM). The stock has exhibited negative returns of 1.63% and 4.07% over the past six months and a one-month period, respectively. Its 52-week high price stands at $6.920, and 52-week low price stands at $5.180, with an average trading volume of ~6.21 million. The stock is trading at a PE multiple of 10.810x, with an EPS of $0.520. It has an annual dividend yield of 3.91%.
Corporate Travel Management Limited (ASX:CTD)
Corporate Travel Management Limited (ASX: CTD) provides innovative and cost-effective travel management solutions to corporate management. It offers end-to-end travel management solutions, including the purchase and delivery of travel services for its clients.
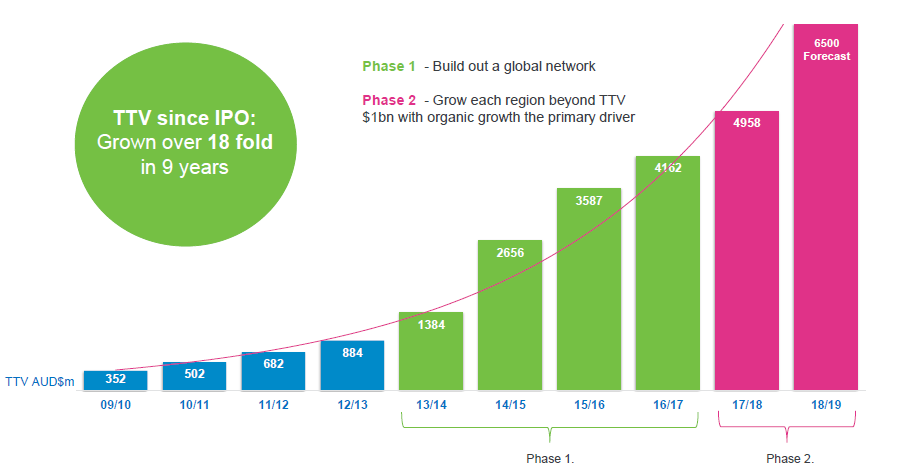
TTV Growth For 25 Consecutive Years (Source: Company Reports)
The total transaction value since IPO has grown over 18 times. The company has three distinct strategic growth phases from FY14 to FY21. In the first phase, the company maintained a strategy to acquire key local agencies in every region as a base to grow. Further, it implemented the CTM client value proposition for strong organic growth and leveraged global presence to win regional/global client segment, in addition to SME/ national clients.
The underlying EBITDA of the company was up approximately 21% to $64.6 million, underpinned by strong organic growth and specifically, record client wins. The underlying NPAT (excluding acquisition amortisation) increased by 20.0% to $42.6 million in 1H FY19.
The company is trending at the top end of FY19 guidance with underlying EBITDA of $150 million, an increase of 20%. The company provided FY19 underlying EBITDA guidance in the range of $144 million to $150 million (approximately +15%-20% growth on the prior corresponding period) with the release of the FY18 results in August 2018.
The operating cash conversion for rolling seven-year average is near 100%, through Phase One and Two expansion. The company expects to achieve approximately 100% operating cash conversion over FY19 and beyond. The half-year reporting date timing differences occur when the reporting period date relative to air and rail fixed payment cycle dates falls at a different time in the payment cycle versus the last reporting period. These timing differences are short term (typically 1-7 days), industry-wide and not isolated to Corporate Travel Management. The company does not require debt to generate high organic growth.
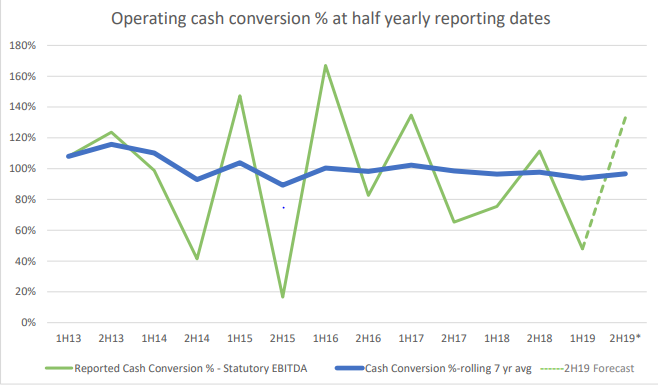
Operating cash conversion % at half yearly reporting dates (Source: Com[any Reports)
The company will focus on the execution of key strategic initiatives during FY19-FY21 through continued organic growth and acquisition, client facing innovation, productivity and internal innovation, leverage scale and geography of the company, etc.
In a client facing innovation, the company continued to develop SMART Technology suite globally, with the development of new tools for its clients. Through regional technology hubs, the company builds a tool that addresses the local or regional market nuances. Moreover, through the empowerment of the staff, the company supports the needs of the clients and will continue its investment to attract, retain, and develop the brightest talent.
On the stock performance front, the share price of Corporate Travel Management Limited was trading at $22.840, with a market capitalisation of ~$2.52 billion (on 14th June 2019, AEST 1:45 PM). The stock exhibited returns of 3.57%, -5.61% and -5.84% over the past six months, three months and one-month period, respectively. Its 52-week high price stands at $33.870, and 52-week low price stands at $19.20, with an average trading volume of 332,448. The stock is trading at a PE multiple of 29.180x, with an EPS of $0.795. It has an annual dividend yield of 1.68%.
Disclaimer
This website is a service of Kalkine Media Pty. Ltd. A.C.N. 629 651 672. The website has been prepared for informational purposes only and is not intended to be used as a complete source of information on any particular company. Kalkine Media does not in any way endorse or recommend individuals, products or services that may be discussed on this site. Our publications are NOT a solicitation or recommendation to buy, sell or hold. We are neither licensed nor qualified to provide investment advice.
