


Based on the market capitalisation, stocks are classified into large cap, mid cap and the small cap stocks. Market capitalisation refers to value of the company centred on the total number of shares multiplied by the current market price.
Large Cap stocks:
Large cap stocks are the well-established companies and tend to have stable revenue and earnings. They generally have a market cap of over $10 billion.
Mid Cap Stocks:
Mid Cap companies is border end of both large and small cap companies i.e. they are smaller than the large caps in terms of revenue, clientele, profitability etc. These have an immense scale of growth and can give the higher returns in the period ranging from 3-5 years. Contrasting to the large-scale companies, all the information might not be available publicly. These companies usually have a market cap ranging from $3 billion to $8 billion.
Small Cap stocks:
Small cap stocks lie on the point of market scale. These are either at the start up stage or are under-developed companies and have low revenue, and a small number of employees and clients. It is quite challenging to obtain the information about these companies. Small Cap are usually considered as the high-risk investments. An investor must analyse the revenue model, profitability and other factors before investing in these stocks.
Due to large and stable nature of their business, the large cap companies usually offer comparatively lower returns due to lower risk involved. However, investorâs having good risk-taking capability, should divert their mind towards midcaps and small-caps because of increased earning returns. Midcap companies try to maintain a balance between the risk and reward and therefore are in a pleasant spot for conscious investors. Mid cap stocks have a benefit over the small caps in terms of raising funds and growth, with less volatility from the market, and over large cap in terms of growth in earnings. Mid cap stocks have beaten the small and the large caps in both the terms of revenue and the profit. But it is important to check the quality of the revenue the firm earns.
Let us now have a glance over mid cap stocks!
Appen Limited (ASX: APX)
Appen Limited (ASX: APX) is a mid-cap company and is an international leader in the expansion of high-quality, human-explained datasets for machine learning and artificial intelligence.
Significant rise in revenue and EBITDA:
During the first half of year ended on 30 June 2019, revenue of the company went up by 60% to $245.1 million, mainly driven by the revenue increase in 2H18 and underlying EBITDA soared by 81% to $46.3 million during the same time span. As a result of good performance, the company declared a partially franked dividend of 4 cents per share. During the 1H19, the underlying NPAT of the company went up by 67% to $29.6 million.
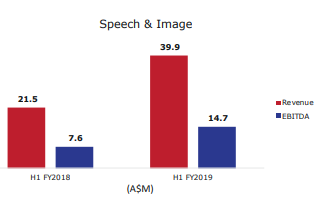
Financial Performance (Source: Companyâs Presentation)
Outlook:
Appen is improving its position in a high growth market through investments in technology, sales & marketing, government markets and China. The company also anticipates the full year EBITDA for the year ending December 31,2019 to be in the range of $85 million - $90 million
Companyâs Performance:
Appen is a mid cap company with a market capitalisation of $2.6 billion and have earned a good revenue in past half year and also demonstrates a good underlying EBITDA. The stock of the company went up by 1.673% from the previous day and closed at $21.880 on 28 October 2019 and have earned a dividend yield of 0.37%. In terms of valuation, the stock is trading at a P/E multiple of 50.960.
AfterPay Touch Group Limited (ASX: APT)
AfterPay Touch Group Limited (ASX:APT) offers the technology driven payment results for consumer and businesses through its afterpay and pay now services.
Response to the media commentary:
The company commented on the regulatory developments following the Reserve Bank of Australiaâs (RBA) 2020 review of payments regulation, including âsurchargingâ practices in Australia. The Company is not subject to an RBA inquiry or review process and is open to engage with the RBA for periodic review of the payments industry in the coming year.
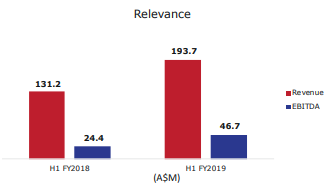
FY19 Growth and Performance:
During the Financial year ended on 30 June 2019, the underlying sales of the company went up by 140% from $2.2 billion in FY18 to $5.2 billion in FY19. AfterPay also witnessed a rise in active customers and active merchants by 130% and 101% respectively. The Company have achieved significant growth, but the immense opportunity continues. It also witnessed strong underlying cash flows and high ROCE mainly due to increase in group receivables by $213.6 million in FY19.
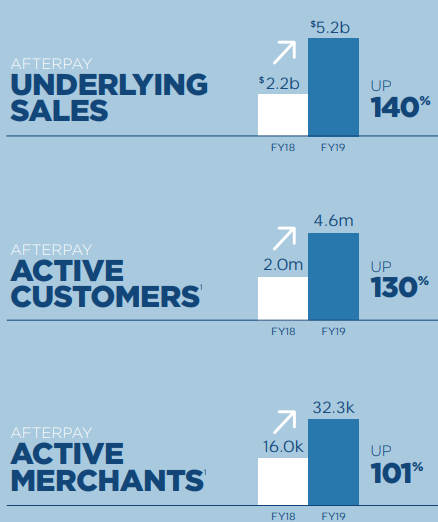
FY19 Growth and Performance (Company annual report)
Future Prospects:
The company anticipates the accelerated growth in the US and to build the business in the UK. It will also continue to invest in Australia and New Zealand and will consider new markets for future prospects.
Stock Performance:
AfterPay is a mid-cap company and the performance of the stock went up by 22.15% in the past 6 months. The company has the market cap of $7.4 billion and ended the day at $28.650 on 28 October 2019, inclining towards its 52-week high levels.
Jumbo Interactive Limited (ASX: JIN)
Jumbo Interactive Limited (ASX: JIN) is involved in retailing of lottery tickets via internet and mobile devices sold in Australia and eligible overseas jurisdictions. Recently, the company has published a presentation, wherein it stated that the new software platform has been proved as a game-changer for Jumbo. It is a four-year project to rewrite the Jumbo Software Platform. On 6th September 2019, the S&P Dow Jones Indices has published a release stating some changes in S&P/ASX indices, which came into effect on 23rd September 2019. It was mentioned in the release that Jumbo Interactive Limited has been added to S&P/ASX 200 Index
The companyâs vision of $1 Billion in ticket sales on the Jumbo platform by FY22 revolves around initiatives such as
- com growth
- Powered by Jumbo SaaS
- UK, Canada and USA
The stock of JIN last traded at $25.38, with a fall of 2.121% on 28 October 2019. The market capitalization of the stock stands at $1.62 billion. The stock has delivered stellar returns of 35.04% and 56.37% during the last three months and six months, respectively.
Companyâs Performance:
Jumbo Interactive Limited is a mid-cap company with a market cap of $1.62 billion and have witnessed a rise in revenue and Net profit margin after tax from continuing operations by 64% and 124% respectively. The performance of the stock went up by 56.37% in the past 6 months and is currently trading at a P/E multiple of 59.070x and is earning a dividend yield of 1.41%.
Disclaimer
This website is a service of Kalkine Media Pty. Ltd. A.C.N. 629 651 672. The website has been prepared for informational purposes only and is not intended to be used as a complete source of information on any particular company. Kalkine Media does not in any way endorse or recommend individuals, products or services that may be discussed on this site. Our publications are NOT a solicitation or recommendation to buy, sell or hold. We are neither licensed nor qualified to provide investment advice.
