


Bubs Australia Limited (ASX: BUB) is an ASX listed company, working in the consumer staples industry. The company is engaged in developing and manufacturing premium infant nutrition products. It is also a major player in the goat dairy products category, having exclusive milk supply from the largest milking goat herd in the country. Apart from serving the domestic market it also exports its products to the Middle East, South East Asia and China.
From the first month of this year, we have witnessed a massive uptrend in the stock price. It could easily be termed as one of the star performers of the sector for the year, giving a massive return of more than 200% (as of 10th May 2019).
The first indication of this massive uptrend was witnessed in January 2019 when the average daily range of prices started to squeeze which represents a kind of indecision by the market participants regarding the buy/sell decision. This kind of price action generally forms before a major upcoming trend (relative to the time frame).
The prices kept narrowing down their range towards the second half of January 2019. On 31st January 2019, the company announced its quarterly activities report for the quarter ended 31st December 2018 and the results surprised the street. The products sales were up 216% year-on-year, Q2 FY19 gross revenue were up 499% year-on-year, China sales were up by 2,281% and domestic growth: up 375% year-on-year, with such strong performance reported by the company, the investors seemed to be in a hurry to buy the stock which drove the price by a massive 23% on the same day.
The volume of shares traded on that day was also quite high. The stock witnessed a total volume of 11.64 million shares in a single day. To put it in perspective the last 20 days average volume on one day before the breakout stood at 645.5k, thatâs more than 1600%. This was the first breakout and initiation of the new uptrend.
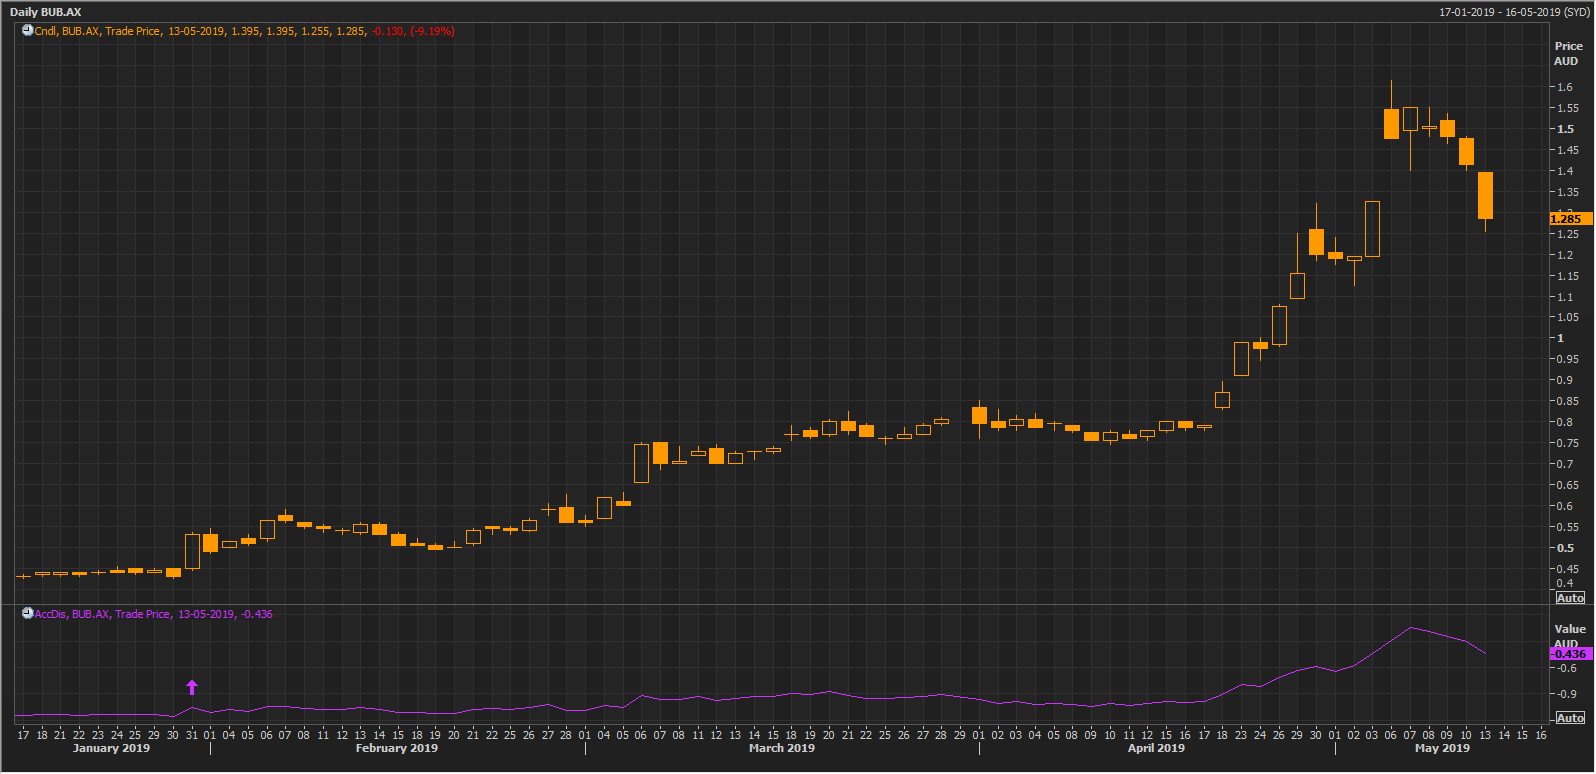 Source: Thomson Reuters BUB Daily Chart
At this point the second confirmation was given by a famous trend following indicator; Average Directional Index (ADX) which also started to turn up, indicating the strength of the new trend. Whenever the ADX is turning up it indicates an increasing strength of a new trend or the current trend (if the market is already trending) and vice versa whenever it turns down. However, ADX does not depict the direction of the trend, on which side the market is moving. So even if the market is trending down, it is still a trend which will only be marked by the rising ADX, not the falling one.
After the breakout and the rising ADX, the stock began to rally with increased volume activity seen throughout the trend. As at the beginning of the trend, the stock was trading below the 20 days average volume 650k shares per day but as of 13th May 2019 the same 20 days volume has gone up to 12.256 million shares per day. This mass participation might probably be the reason for this sustained rally.
Currently, the stock is trading at A$1.260 (as at AEST: 01:30 PM, 13 May 2019), down by 10.954 percent and the gap that was formed on 6 May 2019 is filled by todayâs price action. It is trading below its short-term immediate support at A$1.4 and the next support is at around A$1.19.
Disclaimer
This website is a service of Kalkine Media Pty. Ltd. A.C.N. 629 651 672. The website has been prepared for informational purposes only and is not intended to be used as a complete source of information on any particular company. Kalkine Media does not in any way endorse or recommend individuals, products or services that may be discussed on this site. Our publications are NOT a solicitation or recommendation to buy, sell or hold. We are neither licensed nor qualified to provide investment advice.
