


Summary
- ASX-Listed E-Tailers are presently witnessing a sentiment splash with many such as Kogan.Com Limited (ASX:KGN), JB Hi-Fi Limited (ASX:JBH) hitting record highs.
- While these stocks are hovering around their record highs, chartists are looking and analysing entry and exit point to ride the rally.
- Furthermore, Kogan.com has given a volatility breakout and is now continuing its primary uptrend while JBH failed to do so, making it prone to a retracement back to the mean value of 20-day simple Bollinger band.
E-Tailers have been the direct beneficiaries of the lockdown imposed by various nations to contain the spread and the market anticipates that the new norm of selective movement could be a structural change and would support E-Tailers over the long-term ahead.
Many ASX-listed E-Tailers such as Kogan.Com Limited (ASX:KGN), JB Hi-Fi Limited (ASX:JBH), are in momentum and currently rallying to record highs over the sentiment splash.
ASX-Listed E-Tailers on Charts
Kogan.Com Limited (ASX:KGN)
- KGN on a Daily Chart
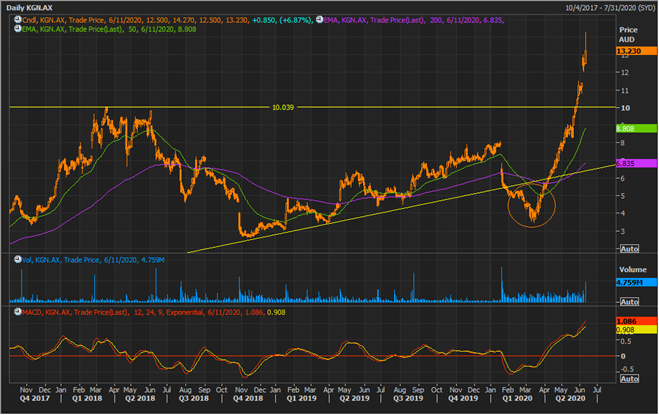
KGN Daily Chart (Source: Refinitiv Thomson Reuters)
On following the daily chart, it could be seen that the stock has given a resistance breakout above the level of $10.039. It should also be noticed that the stock has a back history of a decent rally after a correction, as it could be seen that post rallying till the second quarter of the year 2018, the stock corrected and entered the secondary trend of the primary uptrend, which halted at the end of the year 2018, from where the stock price again rallied and gave a positive cross between the short-term moving average (50-day) and medium-term moving average (200-day) and continued the primary trend till the end of the year 2019.
At the beginning of the year 2020, the stock plunged and even broke-down below the long-term trendline and corrected over 50 per cent to rally again and cross its long-tern horizontal resistance of $10.039; however, the current rally in the stock is a steep rally, angled higher than normally witnessed 45 degree, which requires further investigation.
Furthermore, the stock has been rising on steady volumes and is presently 12,24,9 MACD indicator is showing a positive signal.
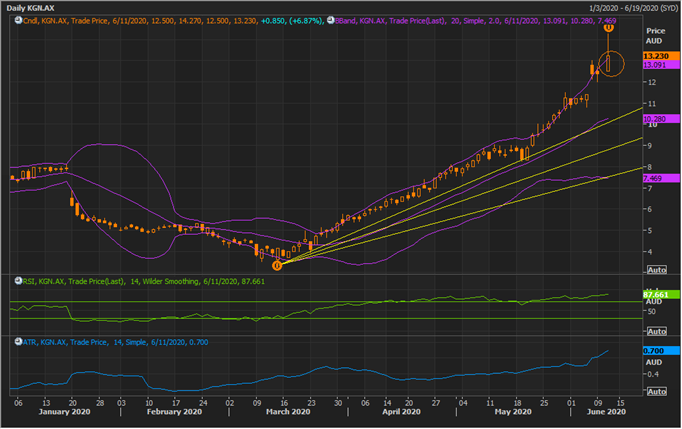
KGN Daily Chart (Source: Refinitiv Thomson Reuters)
On further investigating the daily chart and zooming into the steep rally, it could be seen that the stock has attempted a volatility breakout with prices crossing the +1 Standard Deviation (or SD) of the 20-day simple Bollinger band, and has confirmed the same with the close above the +1 SD, reflecting on the bullish sentiment around the stock.
However, as the rally is steep, in theory, it is prone to correction over the short-term, and its short- to medium-term support could be projected by connecting the recent low to the current high to project a Fibonacci fan.
On connecting the recent low to the current high and projecting the Fibonacci fan, the 1/3 fraction of the fan is the primary and decisive support for the stock as the same support level is overlapping with the support suggested by the mean value of the 20-day simple Bollinger band, which is followed by the 1/2 fraction of the Fibonacci, and 1/3 fraction of the Fibonacci (which is also decisive as it is overlapping with the -1 SD of the Bollinger band).
- KGN on a Weekly Chart
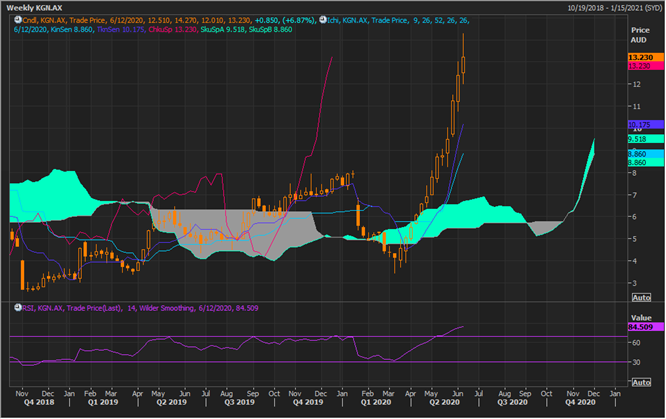
KGN Weekly Chart (Source: Refinitiv Thomson Reuters)
On following the weekly chart, it could be seen that the stock is currently trading above Span A ($9.518) of the Ichimoku cloud (which is the mean value of the conversion line and the base line).
Conversion line- which is the mean value of 9-week high and low (dark blue), and the base line- which is the mean value of the 26-week high and low (sky blue) are also showing a positive crossover with each other and above Span A, reflecting on the clear dominance of bulls.
Furthermore, the spread between the Span A and Span B- which is the mean value of 52-week high and low, is now enlarging with Span A trading above Span B, suggesting that the long-term sentiments are also turning bullish at the present situation.
The 14-week Relative Strength Index is further confirming and complementing the bullish signals given by the Ichimoku study.
JB Hi-Fi Limited (ASX:JBH)
- JBH on a Daily Chart
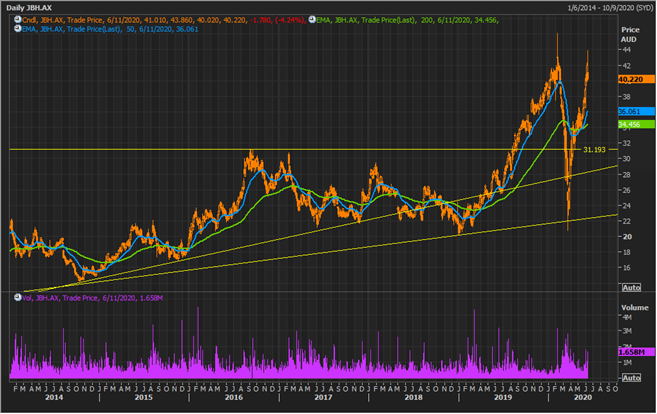
JBH Daily Chart (Source: Refinitiv Thomson Reuters)
On the daily chart, it could be seen that the primary trend of the stock is an uptrend, which entered the phase of correction at the beginning of the year and corrected over 50 per cent from its top to take support around the support zone (the zone between two solid trendlines).
Post taking the support around the support zone, the stock rose took a V-shaped recovery to breach the horizontal resistance line or the level of $31.193. The stock gave and confirmed the breakout above the resistance and at present is showing a positive cross between the short-term (50-day) EMA and the medium-term (200-day) EMA, reflecting upon bullish sentiments around the stock.
Just like KGN, the stock also witnessed a steep rise post correcting over 50 per cent, which requires further investigation.
tility
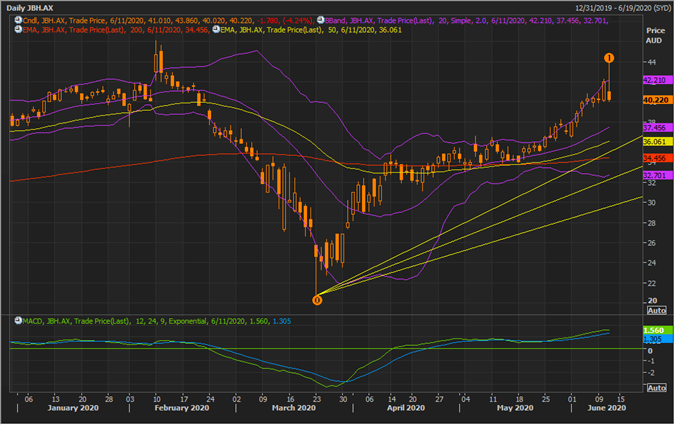
JBH Daily Chart (Source: Refinitiv Thomson Reuters)
On further zooming into the steep rally, it could be seen that the stock attempted a volatility breakout on 11 July 2020; however, failed and closed below the +1 SD of the 20-day simple Bollinger band. The steep rally in the stock further calls for projecting its support (speed lines) which could be done using the Fibonacci fan by connecting the recent low to the present high.
After projecting the Fibonacci, it should be seen that the 1/3 fraction of the Fibonacci fan is the primary and decisive support for the stock (as it is overlapping with the 200-day EMA), followed by 1/2 fraction, which is overlapping with the -1 SD of the Bollinger band.
The 12,26,9 MACD is currently giving a positive signal; however, in theory, a steep rise is usually followed by a correction.
- JBH on a Weekly Chart
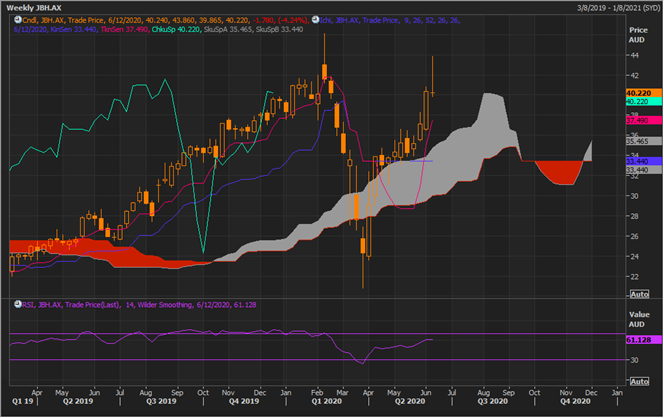
JBH Weekly Chart (Source: Refinitiv Thomson Reuters)
On following the weekly chart, it could be seen that the stock is currently trading above Span A of the Ichimoku cloud with a positive crossover between the conversion line (pink) and the base line (blue), reflecting that now the primary trend is an uptrend.
Furthermore, the spread between Span A and Span B is now enlarging, reflecting upon the strength of bulls, while the 14-day RSI is moving in tandem with the price action and is above its mean value of 50.0.
