


_02_05_2025_05_53_40_418159.jpg)
Gold prices took a steep fall amid strength in dollar prices over the improved economic figures from the United States. The spot gold plunged from the level of US$1303.35 (Dayâs high on 14th May 2019) to the present low of US$1274.83 (as on 20th May 2019 AEST 5:20 PM). The fall in gold prices in the international market marked the fourth consecutive fall, and the gold posted its first weekly loss after ending the previous week at US$1275.06. The gold prices rose previously amid trumpâs tariff announcement on China and Chinaâs retaliation.
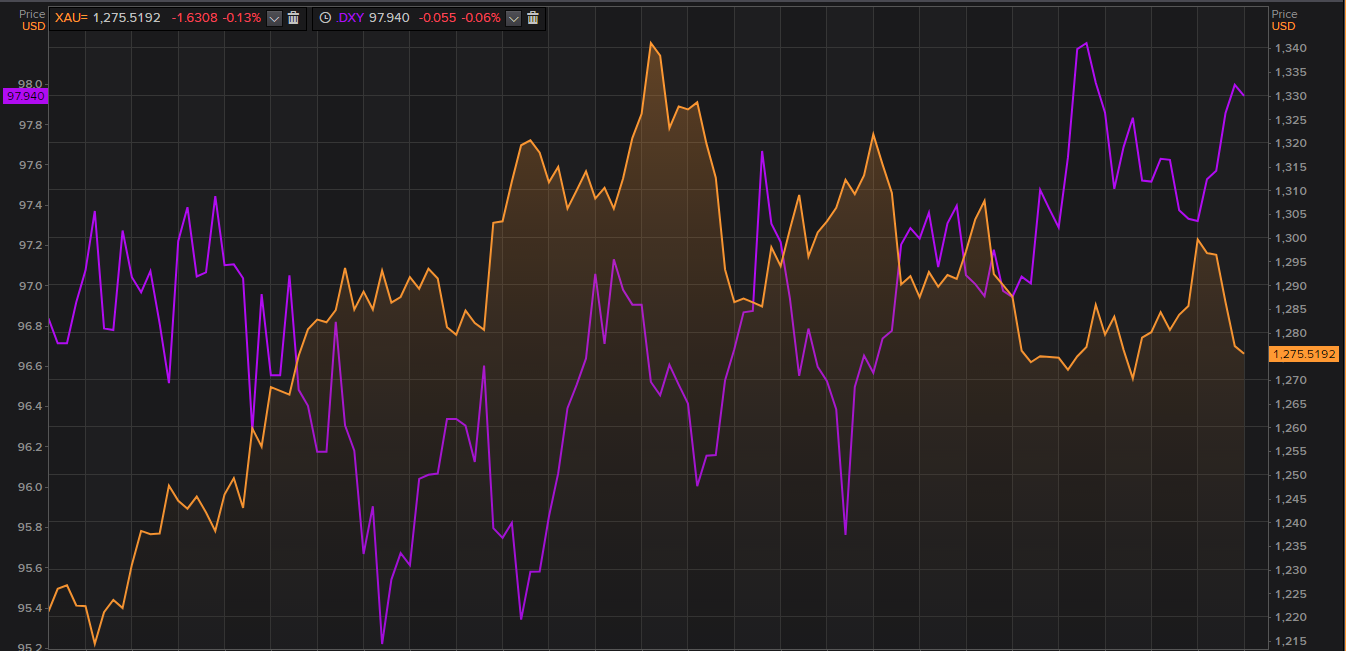 Source: Thomson Reuters; Dollar and Gold Inverse Correlation Chart
An array of improved economic figures supported the dollar prices, which in turn, exerted pressure on gold. The Building permits for April 2019 in the United States grew along with the manufacturing activities.
As per the data, The Building Permits in the United States, which represents annualized number of new residential building permits, stood at 1.30M for the month of April against the market expectation of 1.29M; however, the slight rise alone does not make a significant contribution, but, the data along with the improved manufacturing activities marked an expansion and signalled towards positive outlook for earnings.
The United States Philly Fed Manufacturing Index stood at 16.6 for May (half-month release) as compared to the market expectation of 10.0 and previous level of 8.5. Improvement in both the economic figures supported the dollar prices.
The Dollar Index improved significantly from the level of 97.03 (Dayâs low on 13th May 2019) to the current high of 98.04 (as on 20th May 2019 AEST 6:05 PM). The improvement in the dollar index further increased the appetite of the market for risky assets, which in turn, exerted pressure on gold prices.
 Source: Thomson Reuters; Dollar Index Daily Chart
Another major contributing factor towards the recent dollar run was the third consecutive decline in weekly Unemployment Claims in the United States. As per the data, the Weekly Unemployment Claims declined from the level of 230K (for the week ended 26th April 2019) to the level of 228K (for the week ended 3rd May 2019) initially, and the Unemployment Claims further plunged till 212K (for the week ended 10th May 2019).
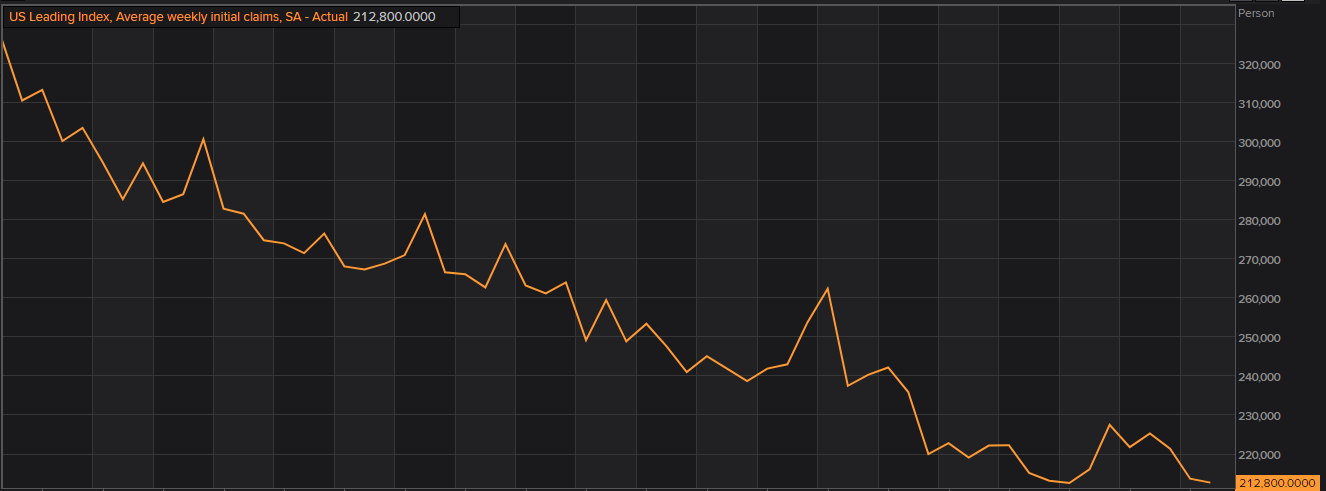 Source: Thomson Reuters; U.S. Weekly Unemployment Claims
The continuous decline in the unemployment coupled with improved economic figures, supported the dollar prices, which in a cascade pulled the gold stings down in the international market.
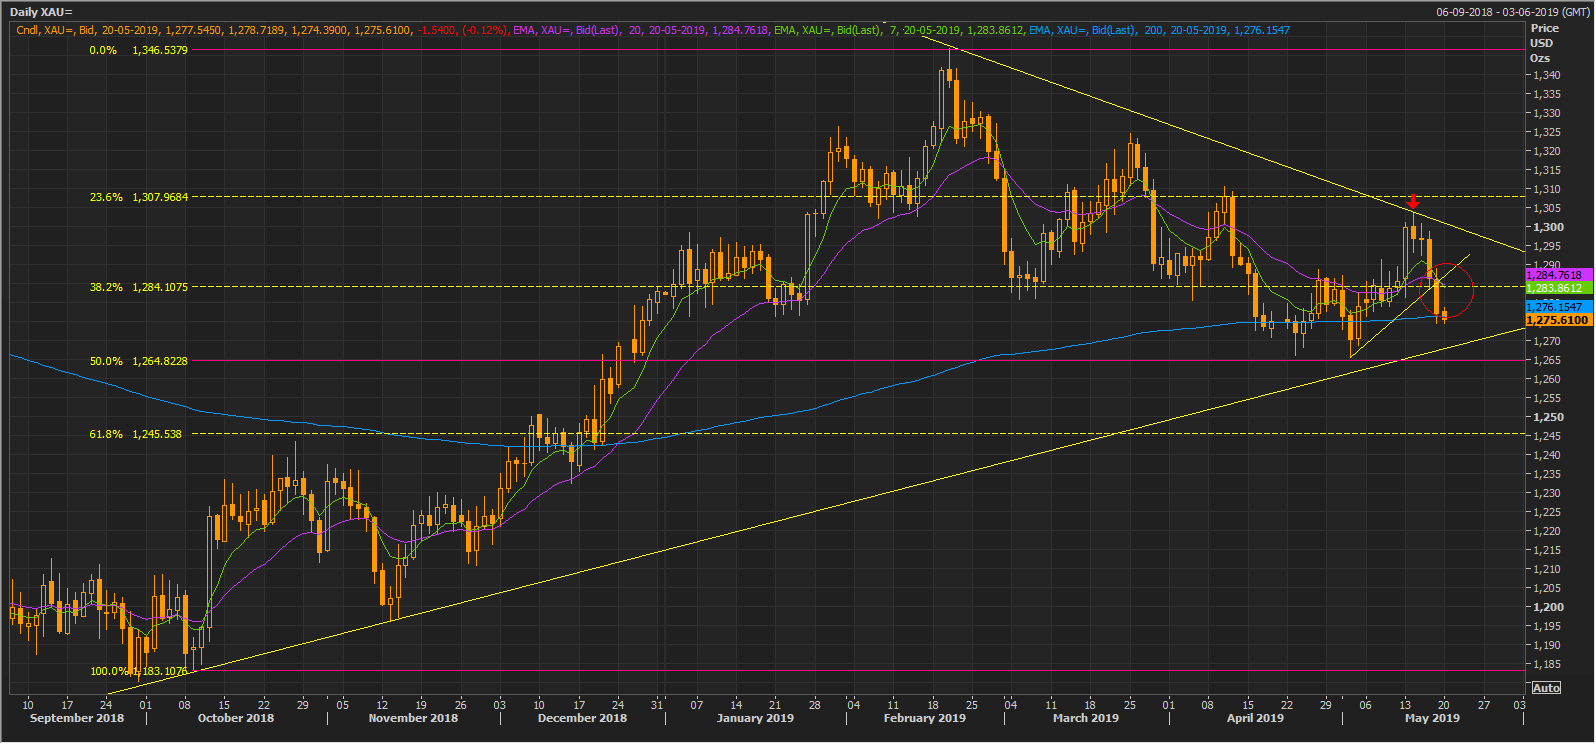 Source: Thomson Reuters; Gold Spot Daily Chart
On Daily chart, the gold prices took a U-turn from the level of $1303.35, as shown with a red downwards arrow, and dollar prices bounced back from the level of 97.03, shown in the dollar index daily chart with a green upwards arrow.
The gold prices are currently moving below the trio of 7,20,200-days exponential moving averages (EMAs) which are at $1283.86, $1284.76, and $1276.15 respectively. The current market price of $1275.61 is below the 200-days EMA, which in turn, expresses that gold losing the upside momentum; however, the closing above or below the 200-days EMA will decide future movement in it.
The shot and medium term- 7&20-days EMAs are crossing each other, with 7-days EMA crossing the 20-days from above, which signifies the presence of a dead cross-over (Bearish Signal), marked by a red circle on the above chart. However, the closing price of gold will further decide if the cross-over remains or not.
Disclaimer
This website is a service of Kalkine Media Pty. Ltd. A.C.N. 629 651 672. The website has been prepared for informational purposes only and is not intended to be used as a complete source of information on any particular company. Kalkine Media does not in any way endorse or recommend individuals, products or services that may be discussed on this site. Our publications are NOT a solicitation or recommendation to buy, sell or hold. We are neither licensed nor qualified to provide investment advice.
