


What are Growth stocks?
A growth stock is the stock of a company that typically generates substantial and positive cash flow and whose revenues and earnings are likely to increase at much faster pace than the average company of the same industry. These companies with growth stocks tend to have a competitive edge which allows them to ward off their competitors. Growth stocks usually pay no or smaller dividends, for the fact that the company would in most cases, reinvest retained earnings in capital projects.
How does one calculate return on Growth Stocks?
When investors hunt for growth stocks, a lot of factors come into consideration which requires robust screening process to conclude the key financial and quality indicators. Amongst these key factors, the following methods can be used to calculate the return on growth stocks:
- Absolute method
- CAGR
The Absolute method is perhaps the most basic method to calculate the stock return. It takes into consideration the difference between end value and the beginning value to conclude the return. A drawback of this method is that is it does not take into consideration the timeline of period of the return calculation. As a result, it is not typically the most trusted and used method and is often replaced by the CAGR method as discussed below.
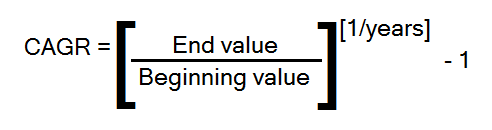
CAGR has an edge over other methods as it takes the timeline into consideration as well. It is basically the average returns that an investor has earned on his investments post a defined interval. This method is used by financial institutes and banks, calculated as below:
Besides, there are few other ways to determine these returns. Some of them are:
- Annualised Returns- This is the geometric average amount of the funds that a particular investment builds each year for a fixed period of time.
- Trailing Returns â This method comes in handy while calculating the historical performance of the funds on a daily, weekly, monthly or annual basis and is perfect for a one-time investment.
- Return since launch- This can be calculated at the time when the New Offer fund gets closed.
Global Growth Stocks
According to market analysts, below are some of the global growth stocks that investors should eye in the present time:
- Adobe (NASDAQ:ADBE)
- Cerner Corporation (NASDAQ:CERN)
- Salesforce.com (NYSE:CRM)
- CSX Corporation (NASDAQ:CSX)
- Amazon.com, Inc (NASDAQ:AMZN)
- Microsoft Corporation (NASDAQ:MSFT)
- Activision Blizzard, Inc (NASDAQ:ATV1)
- Expedia Group (NASDAQ:EXPE)
ASX Listed Growth Stocks
Listed below is a comparative stock return of one year for Altium Limited (ASX: ALU), IDP Education Limited (ASX: IEL), Volpara Health Technologies Limited (ASX: VHT), Webjet Limited (ASX: WEB) and Baby Bunting Group Limited (ASX: BBN). These stocks depict a similar trend of delivering good annual returns.

(Source: ASX)
Let us delve deeper to understand the stock performance and latest buzz with these promising stocks:
Altium Limited
About business: With business history dating back to 1985, Altium Limited (ASX: ALU) is one of the first providers of PCB design tools. It provides, develops and sells electronic design tools, both hardware and software, to be used in the latest devices and technologies.
Financial Performance: The company achieved strong revenue growth of 24% for the first half of fiscal year 2019, amounting to $78.1 million. It expanded its profits to record levels; with EBITDA margin of 36.3%, it witnessed a 58% increment in the NPAT which amounted to $23.4 million.
For FY18 too, the company had delivered record results, with a 26% revenue growth and 34% growth in net profit on pcp.
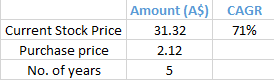
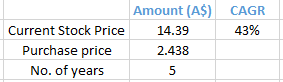
Stock Performance: The company has a market capitalisation of A$4.09 billion. The stock is trading at A$32,190, up 2.8% as on 11 June 2019 (2:54 PM AEST). The P/E ratio of the company is 62.850x. It has given a YTD return of 44.93% till date to its investors.
CAGR calculation (As on 7 June 2019):
IDP Education Limited
About business: A global leader in international educational services, IDP Education Limited (ASX:IEL) provides international student placement services. It is also the owner of International English Language Testing System.
Financial Performance: As per its results for the first half of the 2019 financial year (H1 FY19), the company reported total revenue of $304.3 million, an increase of 26 per cent compared to the same period in FY18. The EBITDA was $66.8 million, 33% up on pcp.
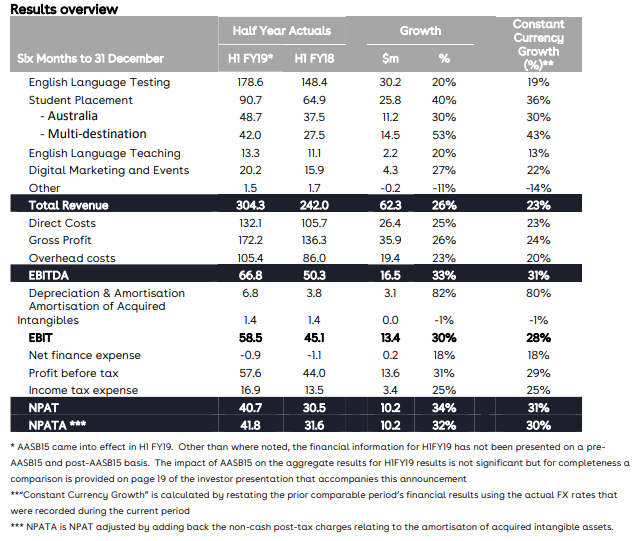
(Source: Companyâs report)
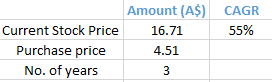
Stock Performance: The company has a market capitalisation of A$4.25 billion. The stock is trading at A$17.290, up 3.47% as on 11 June 2019 (2:54 PM AEST). The P/E ratio of the company is 68.070x. It has given a YTD return of 70.34% till date to its investors.
CAGR calculation (As on 7 June 2019):
Volpara Health Technologies Limited
About business: A leading provider of breast imaging analytics and analysis products, Volpara Health Technologies Limited (ASX:VHT) helps clinicians to understand their patients and administrators to understand their practices.
Financial Performance: As per its recent investor presentation report, the companyâs software has been experiencing great uptake in the US market with a gross margin of approximately 83%. The ARR is anticipated to have grown with a CAGR of 185% per annum from FY16 to FY20. The Forecast ARR in FY20 is deemed to be $7.0 million. The company has a FY20 forecast for overall Annual Recurring Revenue of almost $4.5 million.
Besides, VHT is conducting a fully underwritten A$55 million worth capital raising at A$1.50 per share through Placement to Institutional and Sophisticated Investors of A$45 million and A$10 million Fully Underwritten Accelerated Non-Renounceable Rights Issue (1:27 basis). The raised funds are intended to partly fund the 100% acquisition of medical software company, MRS (total consideration: A$21.15 million).
Stock Performance: The company has a market capitalisation of A$333.53 billion. The stock is trading at A$1.830, down 1.35% as on 11 June 2019 (2:54 PM AEST). It has given a YTD return of 69.79% till date to its investors.
CAGR calculation (As on 7 June 2019):

Webjet Limited
About business: Established in 1998, Webjet Limited (ASX: WEB) is one of Australia and New Zealandâs major innovative online travel agency. It deals with online travel tools and technology. With both B2C and B2B divisions, it is the worldâs first ever Travel Services Aggregator technology. It had acquired Online Republic in 2016.
Financial Performance: The company had presented its HY19 results in February 2019. It delivered a decent first half performance with a 42% increase in EBITDA amounting to $58.0 million. The revenue grew 33% to $175.3 million and NPAT was up 61% to $38.3 million.
Stock Performance: The company has a market capitalisation of A$135.6 million. The stock is trading at A$15, up 4.24% as on 11 June 2019 (2:54 PM AEST). It has given a YTD return of 35.88% till date to its investors. The P/E ratio of the company is 35.740x.
CAGR calculation (As on 7 June 2019):
Baby Bunting Group Limited
About business: Australiaâs largest nursery retailer and one-stop-baby shop, Baby Bunting Group Limited (ASX:BBN) provides baby goods for children from newborn to 3 years of age. It has 52 National superstores and a 11,000 sqm warehouse located at Melbourne.
Financial Performance: As per the companyâs recently released 1H FY19 financial results, the company recorded Sales which were up 17.2% to $177.7 million and a transaction growth of 14.2%. The Gross profit income was up by 22.9% whereas the gross margin was up by 160 bps to 34.6%. The companyâs EBITDA was recorded at $11.6 million which was up by 25.0% on the pcp. The NPAT amounted to $6.0 million and was up by 25.3% on the pcp. At the end of the period, 1H FY19, the company had $6.5 million of cash at its end with an ROFE of 17.6%.
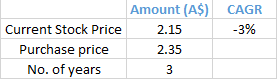
Stock Performance: The company has a market capitalisation of A$271.85 million. The stock is trading at A$2.140, down 0.46% as on 11 June 2019 (2:54 PM AEST). It has given a negative YTD return of 4.02% till date to its investors; though over past one year, the stock price has shot up by 45.27%. The P/E ratio of the company is 26.220x.
CAGR calculation (As on 7 June 2019):
Disclaimer
This website is a service of Kalkine Media Pty. Ltd. A.C.N. 629 651 672. The website has been prepared for informational purposes only and is not intended to be used as a complete source of information on any particular company. Kalkine Media does not in any way endorse or recommend individuals, products or services that may be discussed on this site. Our publications are NOT a solicitation or recommendation to buy, sell or hold. We are neither licensed nor qualified to provide investment advice.
